


- BTC might revisit $66,132 while ETH’s price might slide toward $3,152.
- BNB, SOL, and AVAX prices might end up consolidating in the next few days.
- ADA looked set to fall to $0.58, SHIB might recover while TON could reach $6.50.
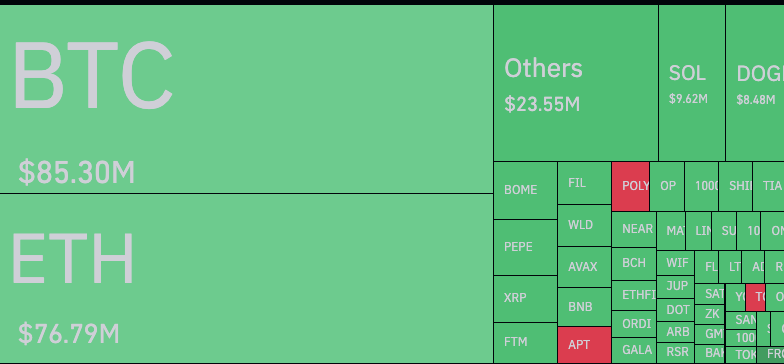
On March 22, the crypto market, led by Bitcoin (BTC) experienced turbulence periods before a mild recovery. During the trading session, the value of BTC plunged to $62,503. This drawdown also spread to altcoins as prices slumped.
Later on, the price jumped and was changing hands at $64,756 at press time. Since hitting $73,000 some days ago, Bitcoin has struggled to revisit the $70,000 region. However, Coin Edition was able to identify one of the reasons that was linked to spot Bitcoin ETFs.
Unlike the previous weeks, ETFs registered high outflows, indicating buyers were less dominant in the market. Buying pressure in the spot market too has been encouraging while leveraged traders have had to suffer from the inconsistencies.
According to Coinglass, contracts worth $259 million were liquidated in the last 24 hours. Out of this, longs accounted for $173.86 million while short liquidations were valued at $85.24 million.
With the weekend already here, how will the prices fare going forward? In this piece, Coin Edition evaluates the price potential of eight of the top 15 cryptocurrencies in the market.
Bitcoin (BTC) Price Analysis
After Bitcoin crashed below $62,000 on March 20, traders increased buy orders and the coin was able to gain support at $61,795. The surge in buying pressure helped BTC flip the $64,640 resistance as the value tapped $68,149.
But at press time, the coin was back around the same resistance area. However, indications from the 4-hour chart showed that bulls were defending the area and preventing BTC from collapsing again.
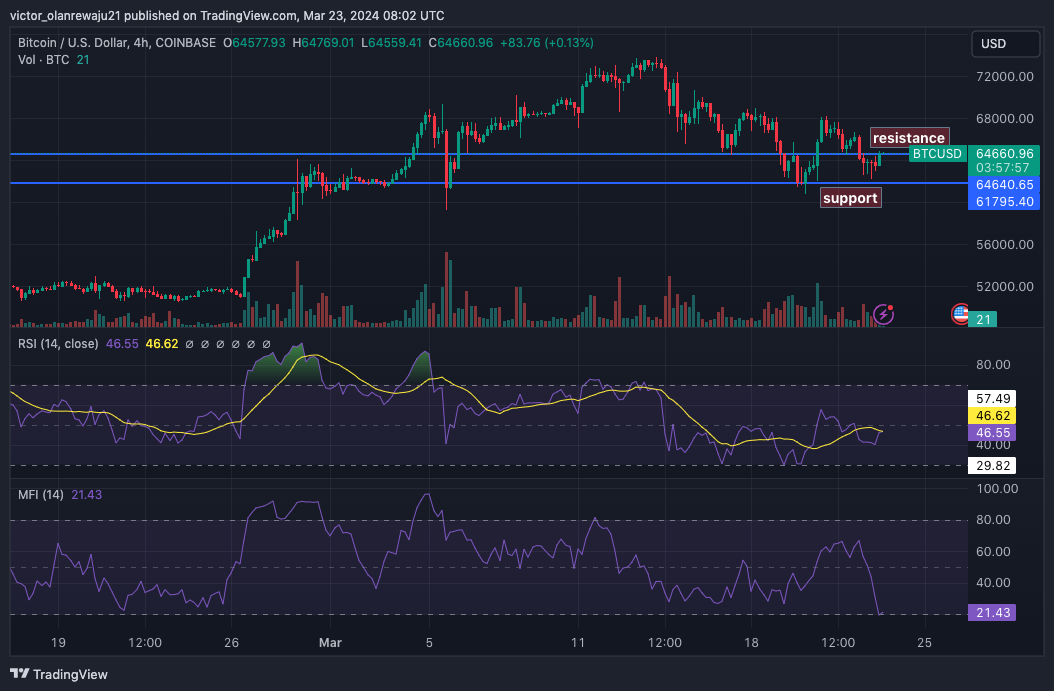
Furthermore, the Relative Strength Index (RSI) looked to be heading back above the 50.00 midpoint. A close above the midpoint could see BTC revisit $66,132. In a highly bearish case, the price might rise as high as $69,000.
Conversely, if the attempted buying momentum stalls, consolidation might be next for the coin. In addition, a correction to $58,501 might occur if bears disrupt bulls’ defense. One reason for this predciton is the Money Flow Index (MFI) which displayed a dearth of capital flow into Bitcoin
Ethereum (ETH) Price Analysis
ETH’s market structure underscored a cryptocurrency recovering from massive selling pressure. At press time, the price was $3,372. However, indications from the Exponential Moving Average (EMA) revealed that the altcoin might not be out of its struggle yet.
As of this writing, the 50 EMA (yellow) was at $3,498. The 20 EMA (blue) on the other hand, was at $3,406. A crossover of the 50 EMA over the 20 EMA is a death cross and it is bearish for the price action.
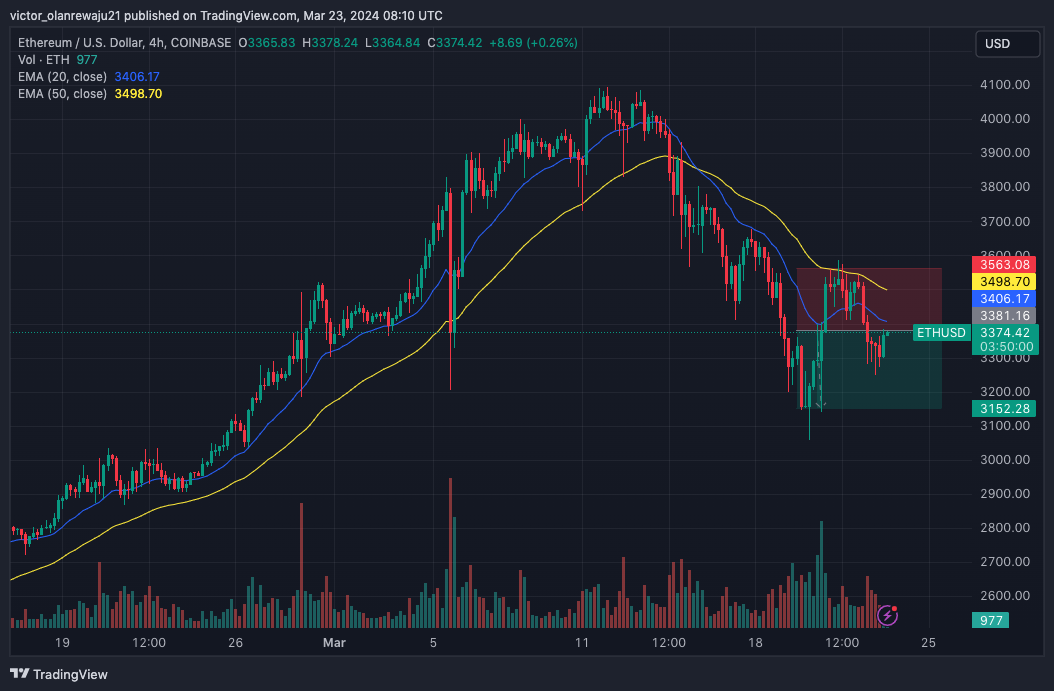
In addition, ETH had slipped below both EMAs, indicating weakness in the uptrend. If buying pressure increases, the cryptocurrency might flip the $3,563 resistance. However, failure to flip the resistance might drive ETH down to $3,152.
Binance Coin (BNB) Price Analysis
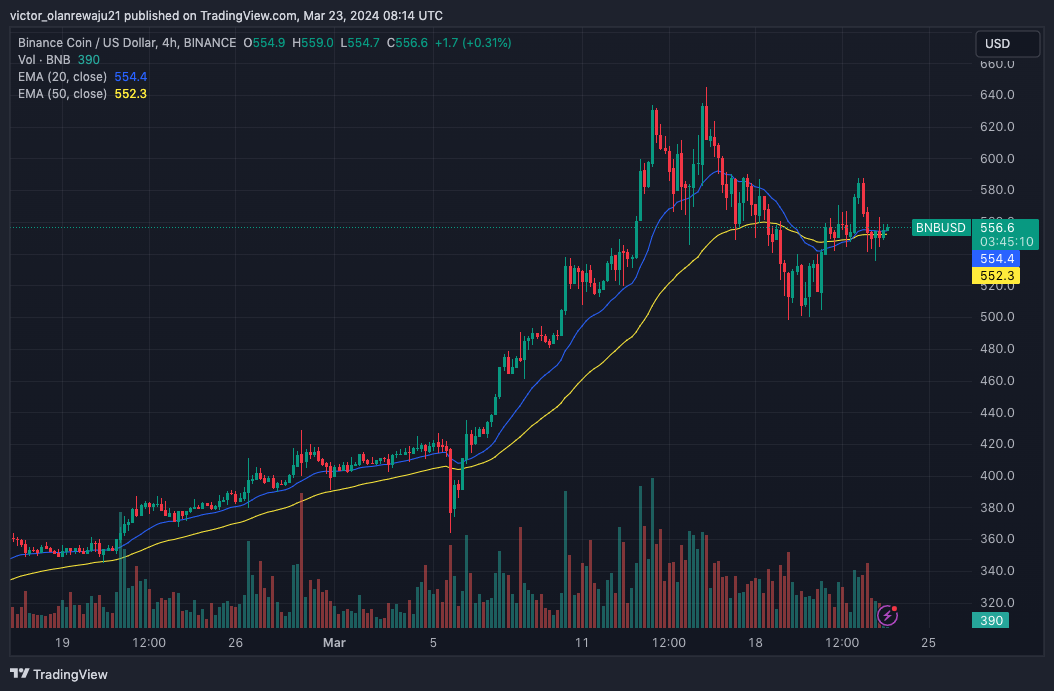
At press time, BNB changed hands at $557. This was a notable fall from its peak of $644. However, the analysis of the coin showed that bulls were unfazed by the downturn and seemed ready to push BNB higher.
But indication from the EMA showed that it could be a struggle. As of this writing, the 20 and 50 EMAs were close to BNB’s price and not too far apart. The inference from this position might cause BNB to consolidate over the next few days. At a low level, BNB might drop to $539 while a move north could drive the price to $570.
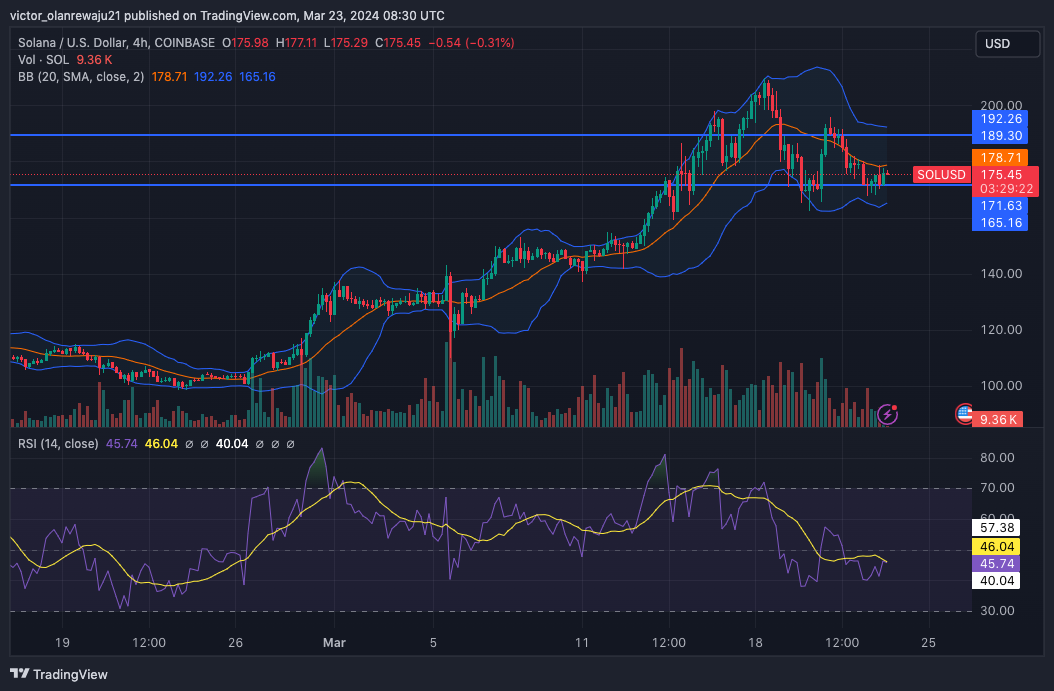
Solana (SOL) Price Analysis
Selling pressure forced SOL’s price down to $171 during the week. However, traders seem to have taken advantage of the decline and are trying to push the price up.
SOL’s attempt to price higher could depend on a crucial resistance at $189. A close above the resistance could help the token retest $192. On the other hand, rejection at that point could send the price back to $165.
A close analysis of the Relative Strength Index (RSI) showed that buying momentum was weak. The Bollinger Bands (BB) also displayed mild volatility, meaning that SOL might find it hard to extend beyond $192.
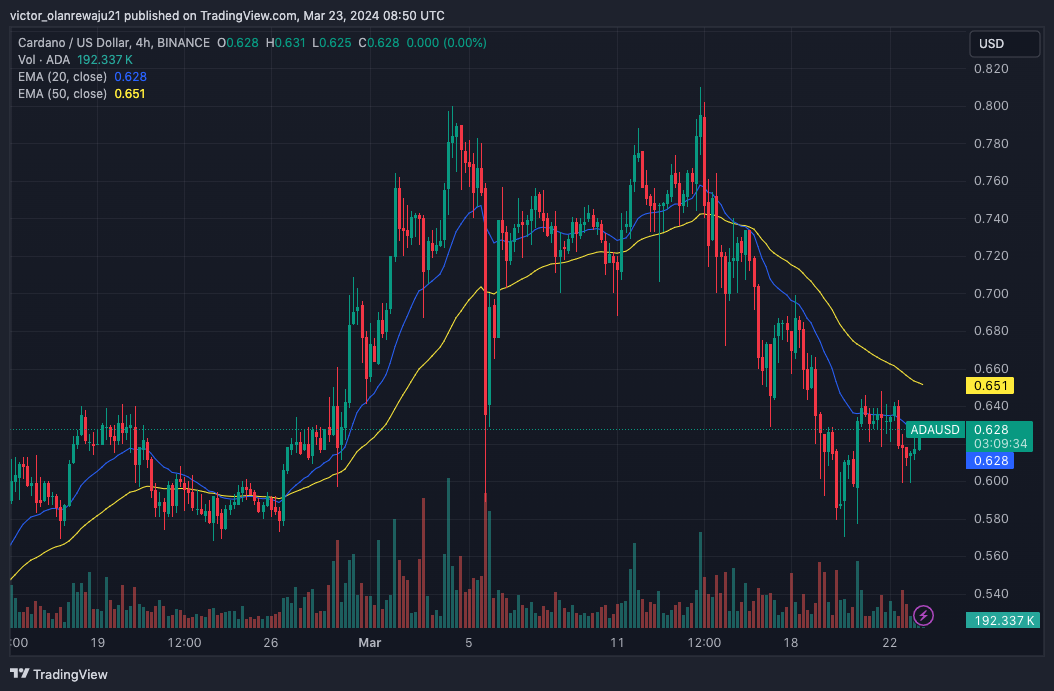
Cardano (ADA) Price Analysis
Cardano had a similar structure to ETH. Like ETH, the ADA/USD 4-hour chart showed that 50 EMA (yellow) had crossed over the 20 EMA (blue). As expected, this is bearish for ADA.
Should this trend last till the weekend comes to a close, the price of ADA might retrace to $0.58. However, a surge in buying pressure might change the state of the token. If this is the case, ADA’s price might rally to $0.68. But as it stands, that upswing looks unlikely.
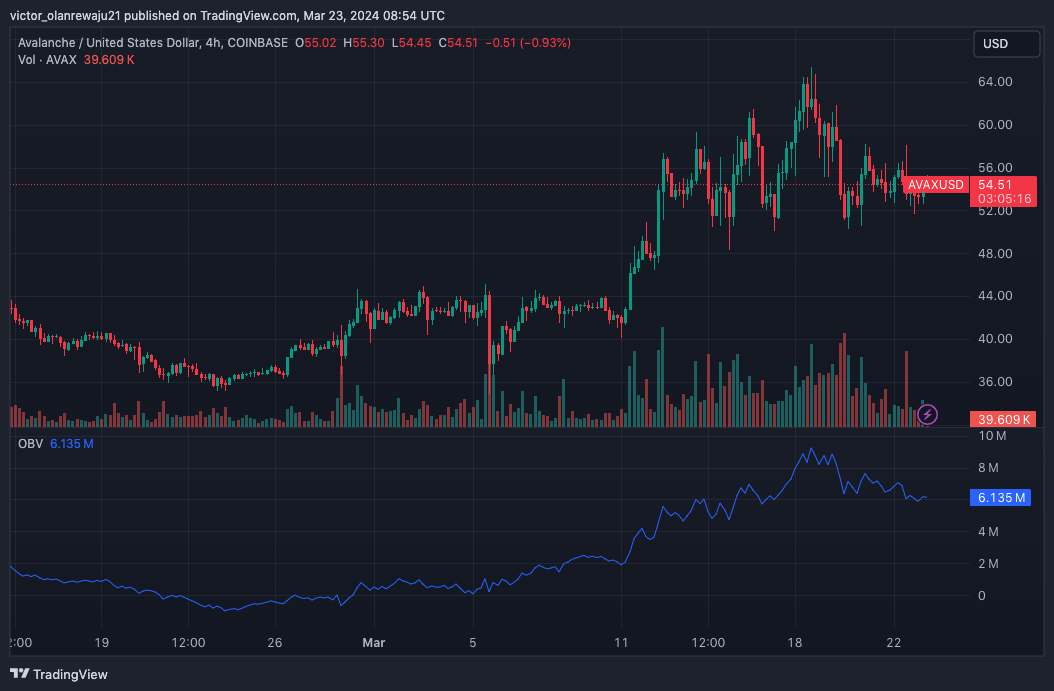
Avalanche (AVAX) Price Analysis
The AVAX/USD 4-hour pair was distorted with selling pressure since March 18. At press time, the token changed hands at $54.52. A look at the On Balance Volume (OBV) showed that positive and negative volume pressures were almost the same.
Hence, AVAX might trade sideways over the forthcoming days. From a bullish perspective, AVAX might jump to $58.10. However, a bearish thesis places the short-term price predciton at $51.29.
Shiba Inu (SHIB) Price Analysis
As of this writing, SHIB has failed to break out of the $0.000027 region. Since March 20, the price of the meme coin has been moving around the same axis.
However, the RSI at press time, had crossed the neutral point. This suggests that buying momentum might have won in the heated context between bulls and bears. A futher increase in the RSI could drive SHIB toward $0.000030.
On the other hand, traders should watch out for resistance at any point. If SHIB’s uptrend gets rejected, the value could decline to $0.000025.

Toncoin (TON) Price Analysis
Toncoin was one of the few cryptocurrencies that registered a notable increase in the last 24 hours. At press time, TON’s price was $5.05, representing a 12.65% increase within the last day.
From the chart below, TON bulls banked on the $4.06 support and the token broke through the $4.47 resistance. Furthermore, the market structure showed that the price might continue to increase as bears have been shoved out of the way.
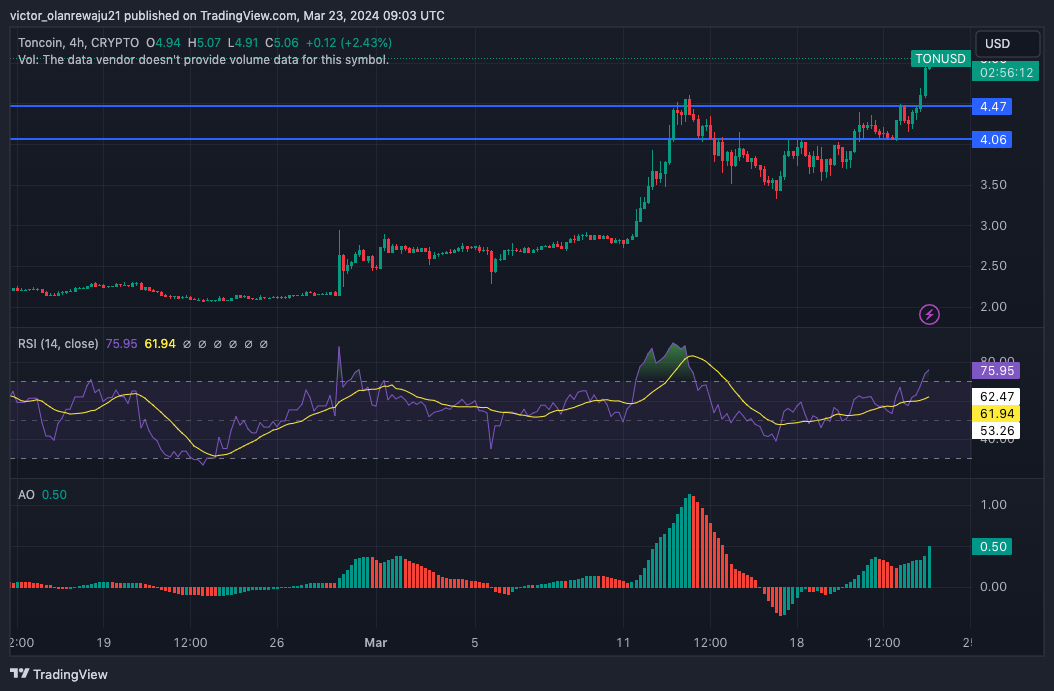
Meanwhile, the Relative Strength Index (RSI) was in the overbought region, suggesting that TON might retrace. However, the absence of selling pressure might invalidate this bias.
In addition, the Awesome Oscillator (AO) was positive, suggesting an increasing upward momentum. With this momentum, TON might climb toward $6.50 in the short term.
Disclaimer: The information presented in this article is for informational and educational purposes only. The article does not constitute financial advice or advice of any kind. Coin Edition is not responsible for any losses incurred as a result of the utilization of content, products, or services mentioned. Readers are advised to exercise caution before taking any action related to the company.


