


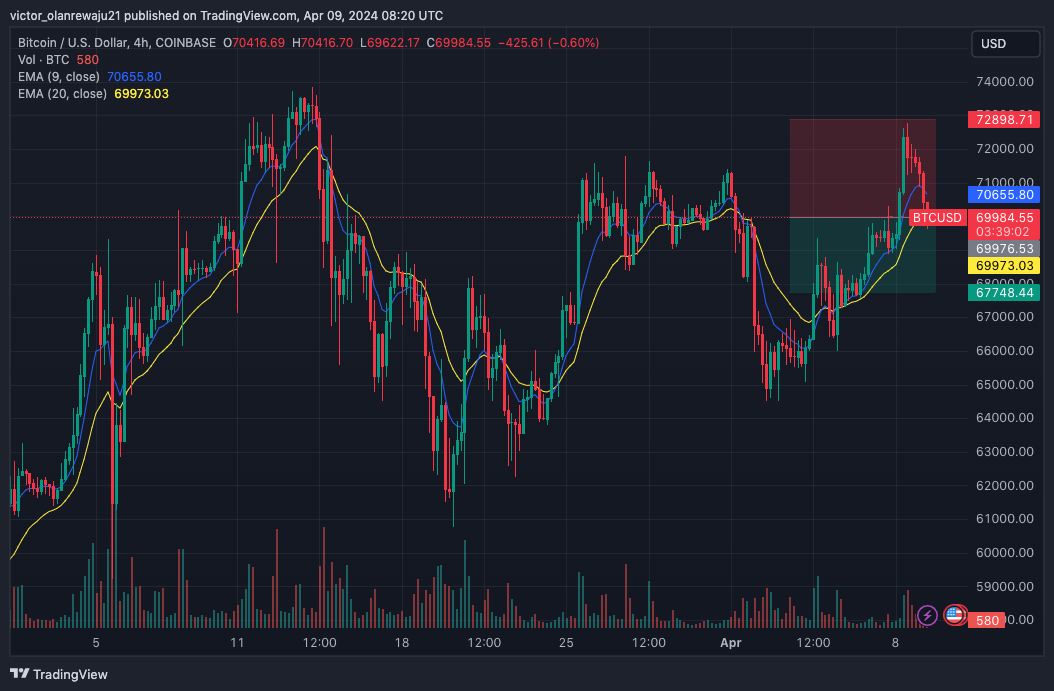
- The BTC/USD chart suggested a decline to $67,784 if the EMA’s positions remained the same.
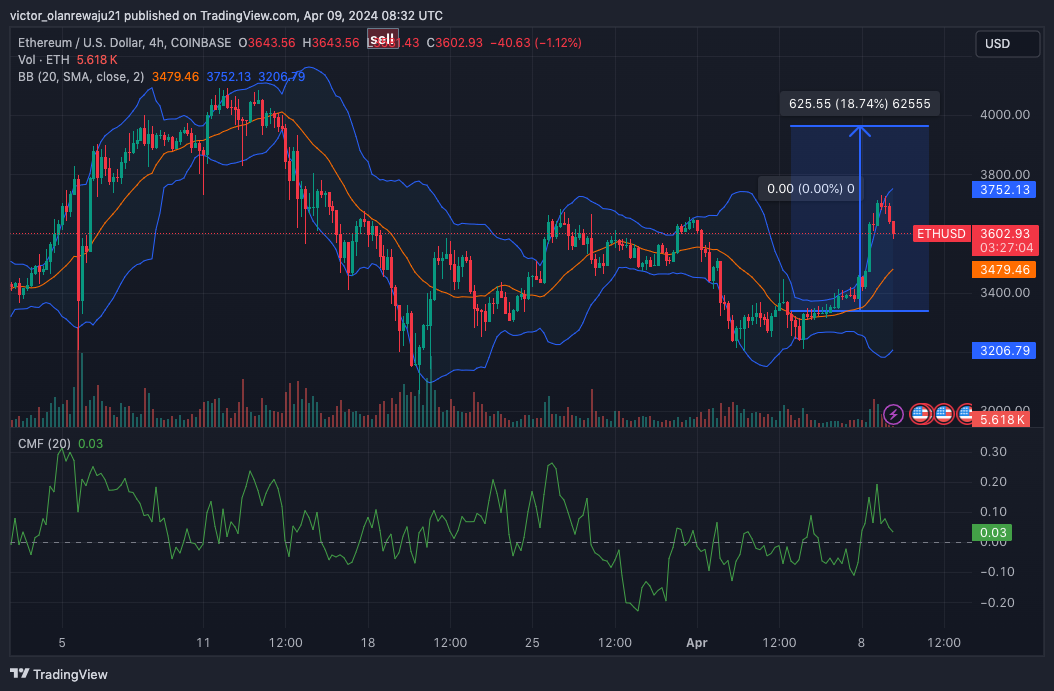
- ETH might rise to $3,970 if bulls can defend the $3,338 support.
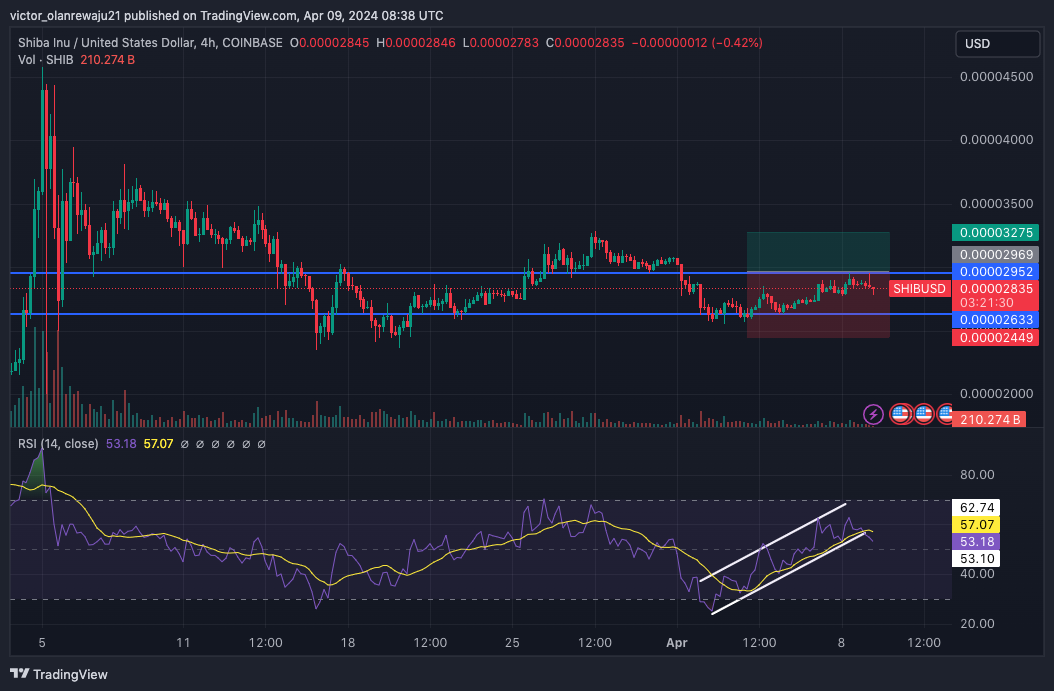
- SHIB and XRP’s prices might fall, with targets at $0.0000244 and $0.58, respectively.
In an interesting turn of events, Ethereum (ETH) outperformed Bitcoin (BTC), even though the latter initially jumped above $72,000 on April 8. According to CoinMarketCap, ETH’s price increased by 6.21% within the last 24 hours, while BTC’s performance was a 1.42% rise.
Besides these two, others like Shiba Inu (SHIB) and Ripple (XRP) also registered minor improvements. While XRP climbed to $0.61, SHIB retested $0.000029 after a 2.26% 24-hour increase.
Bitcoin (BTC)
Bitcoin’s rise to $72,798 was met with rejection, according to data from the 4-hour timeframe. As a result, the price slipped below $70,000, which was a crucial region. This decline could mean that BTC’s dominance was decreasing, considering how ETH outperformed it.
From a technical perspective, the Exponential Moving Average (EMA) showed that BTC might decline further. This was because the price had dropped below the 9 EMA (blue) and a possible decline below the 20 EMA (yellow) was looming.
Should BTC drop below the longer EMA, its price could decrease to $67,784. However, a bearish invalidation could trigger a rebound and send the price above $72,000 once more.
Ethereum (ETH)
Evidence of buying pressure was reflected in the ETH/USD 4-hour chart as the Chaikin Money Flow (CMF) jumped to 0.20. However, the reading had decreased at press time, indicating that bulls had slowed down the momentum.
With the decline, ETH tilted toward a selling bias but the price might not nosedive. Instead, it could move sideways considering that the CMF stayed positive.
In terms of volatility, the Bollinger Bands (BB) revealed that it increased. However, the BB also indicated that ETH was previously overbought, and that was one of the reasons the price fell. In the meantime, an appreciation of $3,970 could be possible in the short term. But this might only be the case if the bulls defend the $3,338 support.
Shiba Inu (SHIB)
SHIB kept trading in a tight range between $0.0000263 and $0.000295, indicating that bulls had not yet exited the claws of bears. Indications from the Relative Strength Index (RSI) showed that the meme coin attempted to create a positive divergence.
But that momentum had been halted, meaning that SHIB might find it hard to revisit $0.0000327 in the short term. Should the momentum continue to trend downward, SHIB’s next target could be around $0.0000244.
Ripple (XRP)
XRP’s price was able to retest $0.62 on April 8, thanks to the support at $0.59. However, the $0.62 region turned out to be a resistance area as the price was rejected. With XRP trading at $0.60, it might be possible that the token might find it difficult to climb to $0.65 in the short term.
According to signals from the Fibonacci retracement indicator, XRP might fall to $0.58, where the $0.236 Fib level was. The Awesome Oscillator (AO) also suggested a similar path for the token, as a red histogram bar appeared.
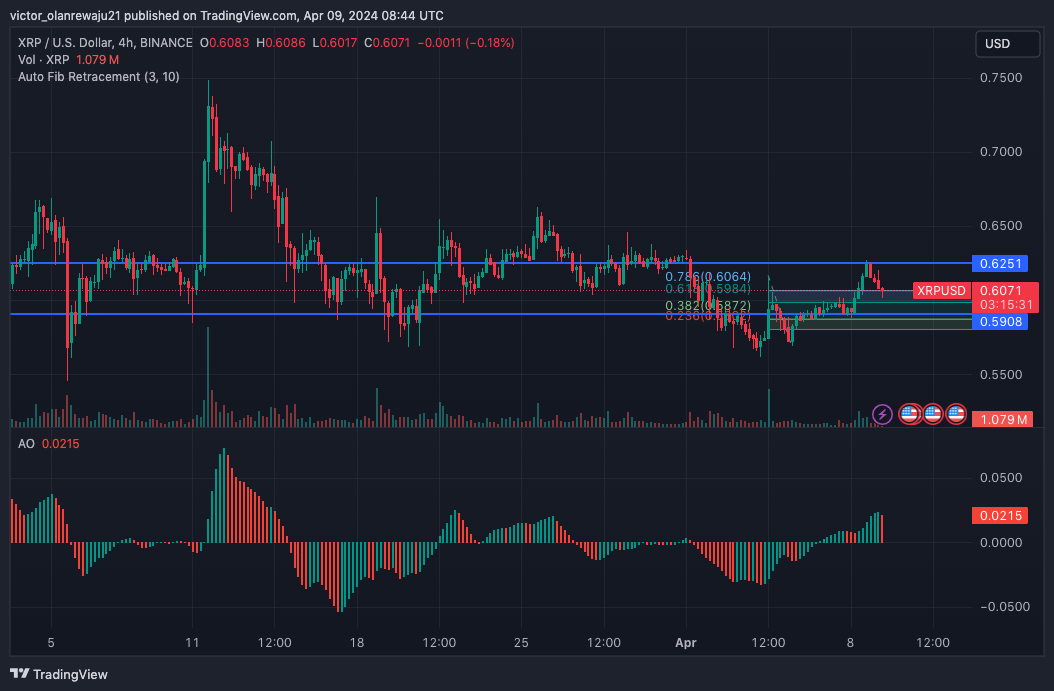
The appearance shown by the AO could foster increasing downward momentum for XRP, unless market sentiment changes.
Disclaimer: The information presented in this article is for informational and educational purposes only. The article does not constitute financial advice or advice of any kind. Coin Edition is not responsible for any losses incurred as a result of the utilization of content, products, or services mentioned. Readers are advised to exercise caution before taking any action related to the company.

: What Happens If You Use an Unlicensed Platform?")


