
- Bullish invalidation suggested that SOL could drop to $159.50.
- TON’s price might climb to $6.75 while the death cross on the ADA chart indicated a possible decline to $0.43.
- Money flowing into ATOM increased, suggesting that the price might hit $8.74.
Despite a few days of upswings in the market, many altcoins ended up with a decline in the last seven days. According to CoinMarketCap, some of those affected include Solana (SOL), Toncoin (TON), Cardano (ADA), and Cosmos (ATOM).
However, projections suggest an altcoin season could be on the horizon following the approval of Ethereum spot ETFs later next week. Here’s an analysis of these four tokens regarding their short-term performances.
Solana (SOL)
Earlier in the week, there were predictions that SOL might hit $200. However, the token failed to achieve that, reaching a ceiling of $189 before the upswing reversed.
According to the 4-hour SOL/USD chart, the 20 EMA (blue) had crossed over the 50 EMA (yellow) since May 15. This was vital to the SOL’s uptrend. While the positions remained the same as of press time, SOL’s price remained below both EMAs, suggesting that the bullish thesis was getting invalidated.
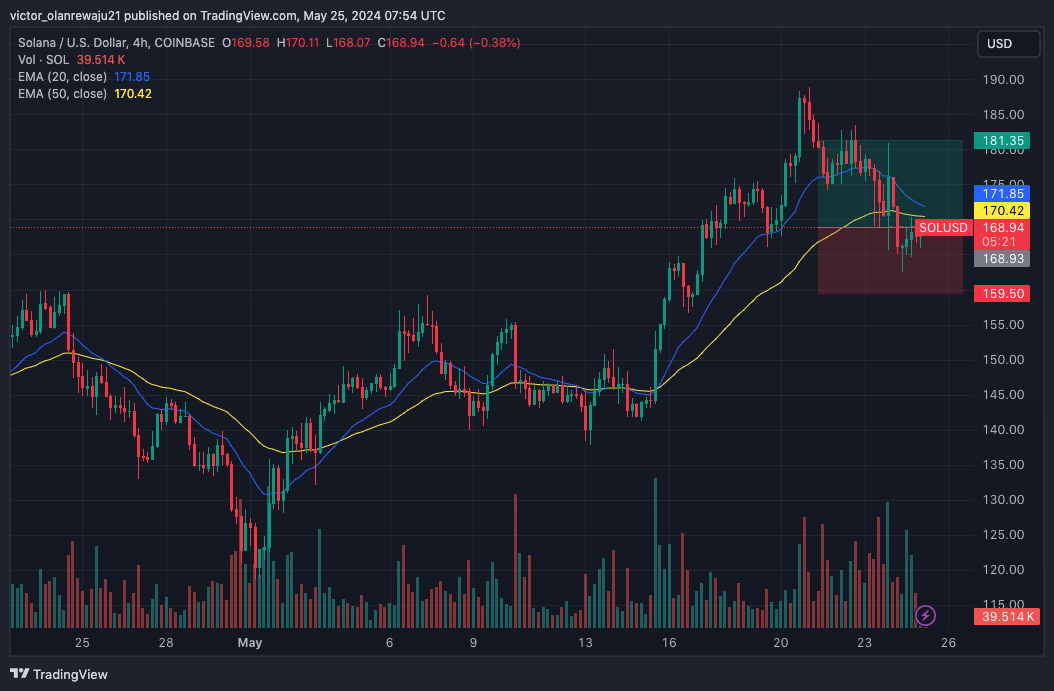
SOL/USD 4-Hour Chart (Source: TradingView)
Should this remain the case, SOL could drop to $159.50. However, a rise past the indicators could send the token’s value to the 181.35 resistance.
Toncoin (TON)
TON’s price was $6.31 as of press time while cementing its place as the 9th most valuable cryptocurrency in terms of market cap. As of this writing, the Relative Strength Index (RSI) on the 4-hour chart sat below the 50.00 midpoint, suggesting that the momentum around TON was not bullish.
However, it seemed that bulls were attempting to push the price upwards. If the RSI reading rises, the price of TON might climb toward the $6.75 resistance. However, an invalidation could send the price of the token down to $5.80.
Also, Coin Edition looked at the Awesome Oscillator (AO) which was negative, indicating increasing upward momentum. However, the green histogram bars that appeared suggested that an uptrend could be emerging.

TON/USD 4-Hour Chart (Source: TradingView)
Cardano (ADA)
At press time, ADA was trading at $0.46, representing a 4.18% decline in the last seven days. While the cryptocurrency has consolidated in the last 24 hours, technical indicators revealed that the slide might not be over.
According to the ADA/USD 4-hour chart, the token has witnessed a significant plunge since the price hit $0.51. This decline was a sign of increased selling pressure. Furthermore, the 50 EMA (yellow) had crossed over the 20 EMA (blue).
This was a death cross and a bearish sign for Cardano. Based on current trends, ADA’s price might not recover soon but a decrease to $0.43 could be next.
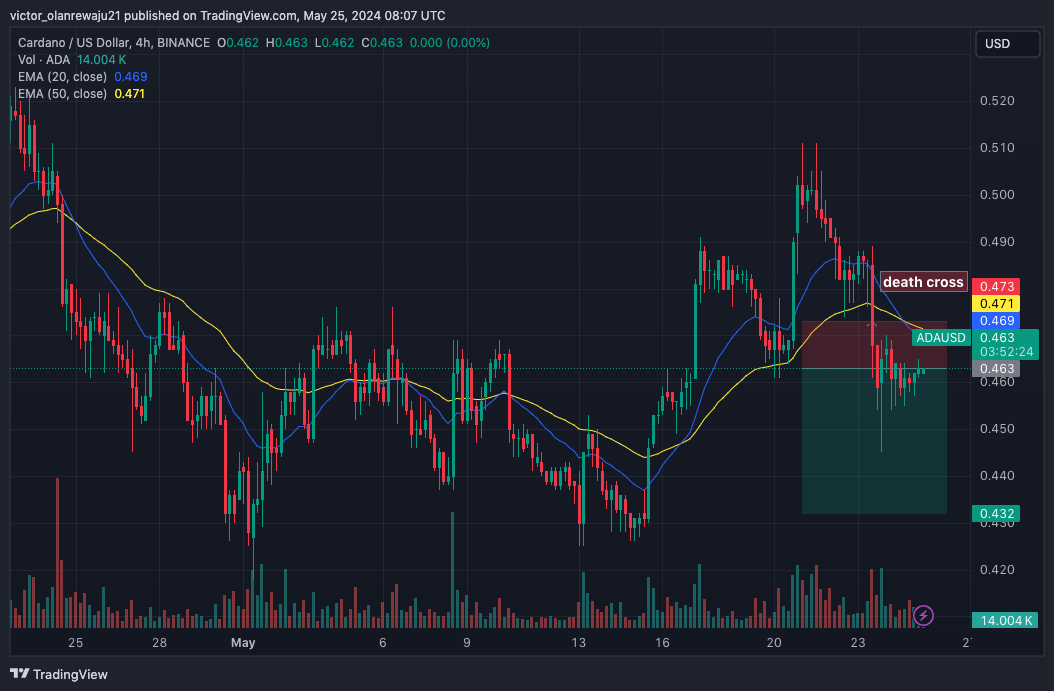
ADA/USD 4-Hour Chart (Source: TradingView)
Cosmos (ATOM)
Although ATOM’s price increased by 3.17% in the last 24 hours, the seven-day performance was a 2.12% decrease. This placed the price of the token at $8.48 at press time.
From a technical point of view, the Money Flow Index (MFI) has increased. Previously, the indicator was below 20.00, indicating that the token was oversold. As such, it seemed that a rebound was in the works.
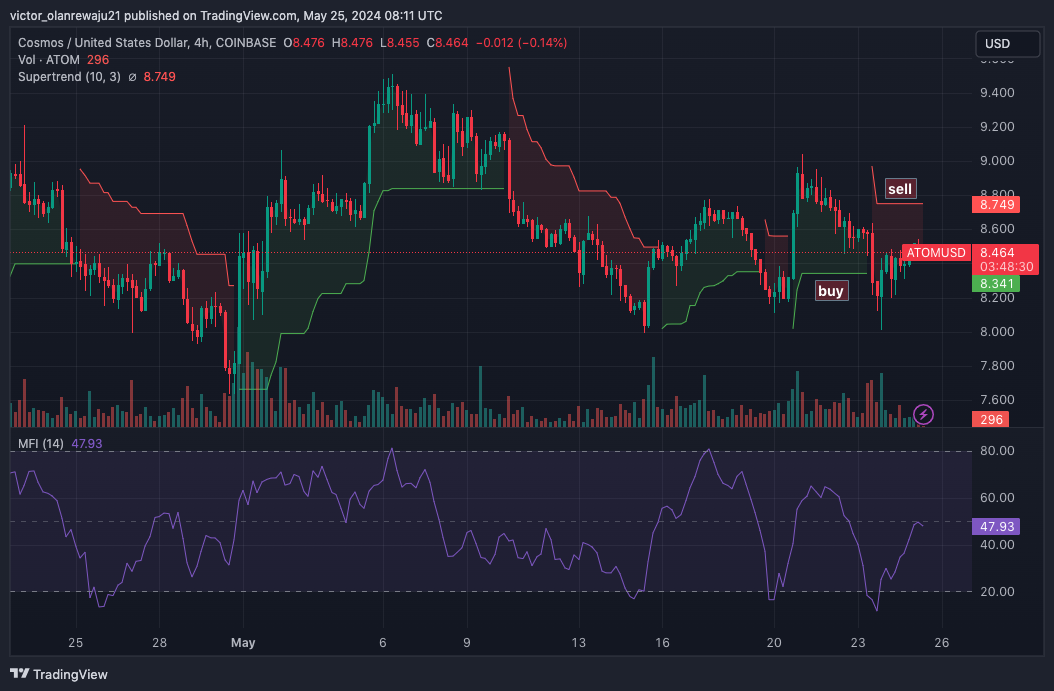
ATOM/USD 4-Hour Chart (Source: TradingView)
In addition, the Supertrend indicator flashed a buy signal at $8.34 which bulls seem to have taken advantage of. However, the same indicator showed a sell signal at $8.74, meaning the uptrend might soon be rejected.
Disclaimer: The information presented in this article is for informational and educational purposes only. The article does not constitute financial advice or advice of any kind. Coin Edition is not responsible for any losses incurred as a result of the utilization of content, products, or services mentioned. Readers are advised to exercise caution before taking any action related to the company.

 Price Prediction: Weak Momentum Signals Possible Drop to $62K")

 Price Prediction for April 2026: Will Chainlink Move Higher?")
 Price Prediction: Can Bulls Sustain the $0.045 Push?")