


 Hits Nine-Month High: Will Bullish Rally Continue?")
- RDNT hits a 9-month peak at $0.4223, soaring 100% in 6 months.
- Investor interest spikes, with RDNT’s 24-hour volume up by 37.82%.
- RDNT’s MFI at 84 signals overbought conditions, hinting at a pullback.
Following a gloomy week, bulls in the Radiant Capital (RDNT) market have suppressed their rally in the previous 24 hours, with support at $0.3989 created. As a result, bulls raised the RNDT price to a nine-month high of $0.4223 before encountering resistance in the last 24 hours, marking a 100% increase in the previous six months.
However, bullish momentum had faded at press time, with RDNT trading at $0.4047, up 1.16% from the intra-day low.
Concurrently, the RNDT’s market capitalization and 24-hour trading volume increased by 1.62% and 37.82%, respectively, to $181,371,374 and $73,572,473. This jump suggests an increase in investor interest and trading activity in RDNT.
The next significant resistance level to watch is $0.4250, which may determine the short-term price direction of RDNT. A consolidation phase may follow if the bullish surge fails to break through this resistance level.
RDNT/USD Technical Analysis
The Money Flow Index (MFI) rating of 84 on the 24-hour RDNT/USD price chart indicates that the present uptrend may be overbought, which could lead to a short-term price drop. This pattern shows that investors should consider taking profits or placing stop-loss orders to protect against a possible price correction.
If the MFI rating remains strong and continues to rise, it may signal that RDNT will soon have further upside potential. However, a dropping MFI rating could indicate a reversal in the present upswing, prompting investors to reconsider their positions.
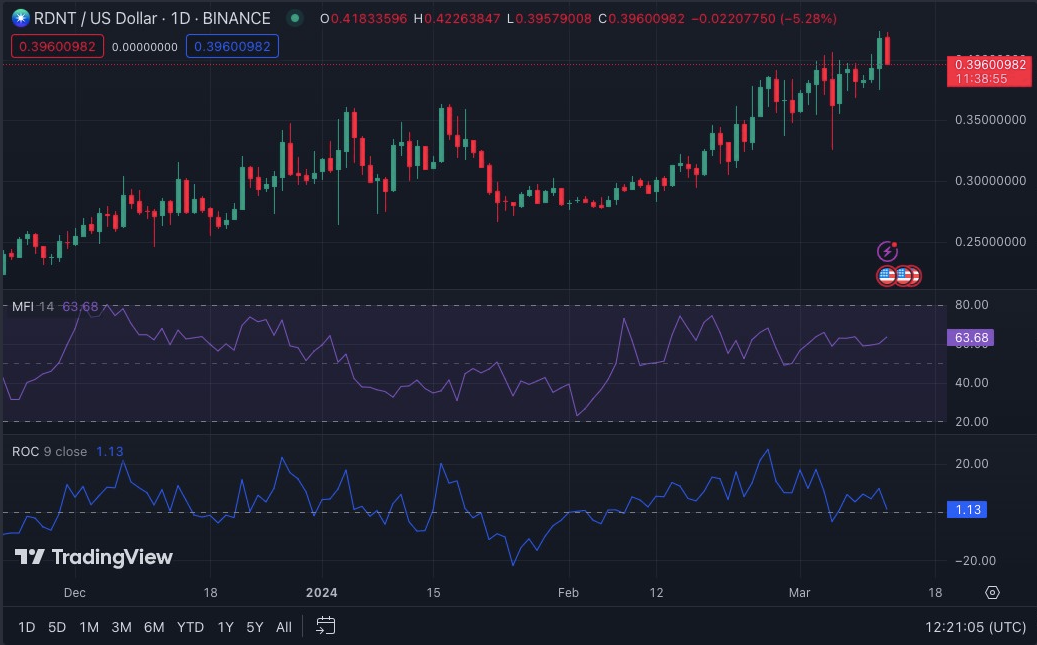
However, the Rate of Change (ROC) trend south, with a rating of 1.93, indicates that momentum is decreasing, which could support the assumption of a short-term price drop. The ROC indicator is used to determine the rate at which a token’s price changes over a given period, offering insight into potential fluctuations in momentum. As a result, if the ROC slips into negative territory, it may suggest a weakening trend, which investors should actively monitor.
The Relative Strength Index (RSI) rating of 59.16 and movement below the signal line indicate that RDNT may be losing momentum in the short term. This pattern could result in a stabilization period or a modest price reduction before resuming upward growth. However, if the RSI rating remains above 50 and begins to move upward, it may signal that RDNT’s positive momentum will continue.
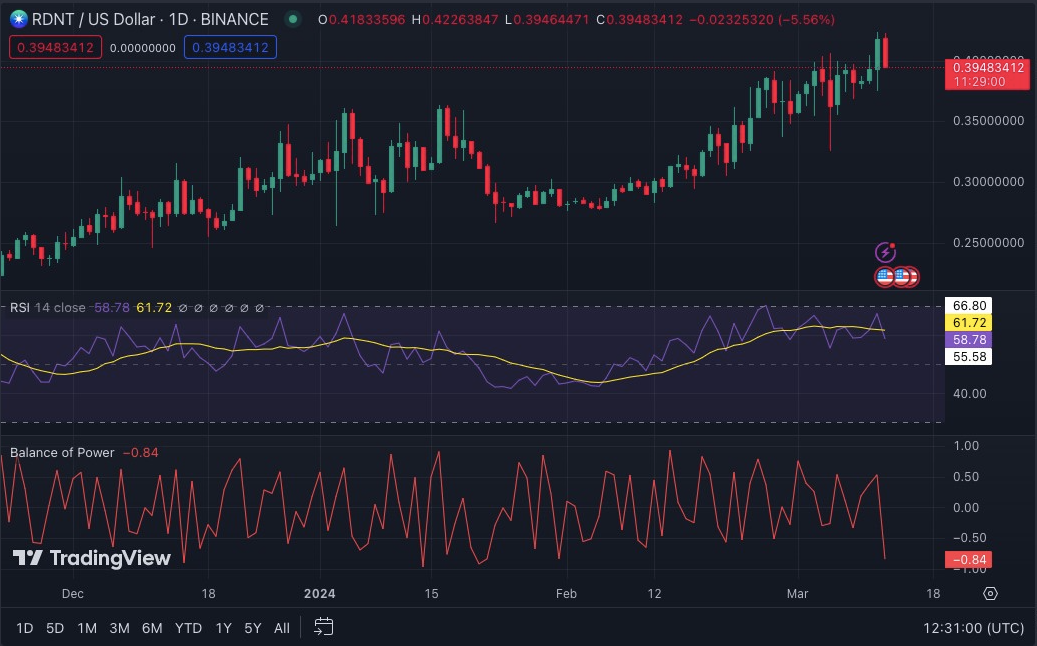
Furthermore, the Balance of Power (BOP) rating of -0.85 indicates that there is currently more selling pressure than purchasing pressure in the market for RDNT. If this imbalance persists, it could lead to further short-term declines. If the selling pressure remains, RDNT’s price may fall further before reversing. However, if purchasing pressure begins to overcome selling pressure, the market may have a turnaround and restart its upward trend.
Disclaimer: The information presented in this article is for informational and educational purposes only. The article does not constitute financial advice or advice of any kind. Coin Edition is not responsible for any losses incurred as a result of the utilization of content, products, or services mentioned. Readers are advised to exercise caution before taking any action related to the company.
 Price Prediction 2026, 2027, 2028, 2029, 2030-2050")
 Price Prediction 2026, 2027, 2028, 2029, 2030-2050")


