 Price Prediction 2023-2030: Will RAD Price Hit $5 Soon?")
- Bullish Radicle (RAD) price prediction ranges from $1.377 to $6.420
- Analysis suggests that the RAD price might reach above $5
- The RAD bearish market price prediction for 2023 is $1.533
Table of contents
- What is Radicle (RAD)?
- Radicle (RAD) Market Overview
- Analysts’ Views on Radicle
- RAD Current Market Status
- Radicle (RAD) Price Analysis 2023
- Radicle (RAD) Price Prediction 2023-2030 Overview
- Radicle (RAD) Price Prediction 2023
- Radicle (RAD) Price Prediction 2024
- Radicle (RAD) Price Prediction 2025
- Radicle (RAD) Price Prediction 2026
- Radicle (RAD) Price Prediction 2027
- Radicle (RAD) Price Prediction 2028
- Radicle (RAD) Price Prediction 2029
- Radicle (RAD) Price Prediction 2030
- Radicle (RAD) Price Prediction 2040
- Radicle (RAD) Price Prediction 2050
- Conclusion
- FAQ
What is Radicle (RAD)?
Radicle is a sovereign peer-to-peer network for code collaboration, built on top of Git, a source code management repository. Radicle enables users to run their own nodes, ensuring censorship-resistant code collaboration while it simultaneously fosters a resilient network without relying on third-parties.
Furthermore, Radicle stores all social artifacts in Git and signs them using public-key cryptography. It verifies the authenticity and authorship of all data automatically, as such all the artifacts are safe and secure with Radicle.
As Radicle is local-first, it provides always-available functionality even without internet access. Since RAD can be accessed and operated without internet access, users can make migrate, back up, and access their data both online and offline easily.
Radicle (RAD) Market Overview
HTTP Request Failed... Error: file_get_contents(https://pro-api.coinmarketcap.com/v2/cryptocurrency/quotes/latest?slug=radicle): Failed to open stream: HTTP request failed! HTTP/1.1 429 Too Many Requests
Analysts’ Views on Radicle
Anbessa, a crypto and stock market chart analyst compared $RAD with $UMA and $BETA and deduced that all three tokens were on exponential growth. To illustrate this pattern, we could see that the analyst used Ichimoku Cloud, Volume, and the RSI indicator.
When scrutinizing the fluctuation pattern of all three tokens, we could see that they were emitting similar behavior. All three of the tokens had a fall and then a period of consolidation. More importantly, the depth of the fall and the amplitude (range) of fluctuation during the period of consolidation seem to be quite similar.
RAD Current Market Status
Radicle (RAD) has a circulating supply of 49,829,111 RAD coins, while its maximum supply is 99,999,620 RAD coins, according to CoinMarketCap. At the time of writing, RAD is trading at $3.45 representing 24 hours increase of 7.16%. The trading volume of RAD in the past 24 hours is $310,642,601 which represents a 146.25% increase.
Some top cryptocurrency exchanges for trading Radicle (RAD) are Binance, Mandala Exchange, Huobi Global, Crypto.com Exchange, and Gate.io.
Now that you know Radicle and its current market status, we shall discuss the price analysis of Radicle (RAD) for 2023.
Radicle (RAD) Price Analysis 2023
Will the RAD blockchain’s most recent improvements, additions, and modifications help its price rise? Moreover, will the changes in the payment and crypto industry affect RAD’s sentiment over time? Read more to find out about RAD’s 2023 price analysis.
Radicle (RAD) Price Analysis – Bollinger Bands
The Bollinger bands are a type of price envelope developed by John Bollinger. It gives a range with an upper and lower limit for the price to fluctuate. The Bollinger bands work on the principle of standard deviation and period (time).
The upper band as shown in the chart is calculated by adding two times the standard deviation to the Simple Moving Average while the lower band is calculated by subtracting two times the standard deviation from the Simple Moving Average.
When this setup is used in a cryptocurrency chart, we could expect the price of the cryptocurrency to reside within the upper and lower bounds of the Bollinger bands 95% of the time.
The above thesis is derived from an Empirical law also known as the three-sigma rule or the 68-95-99.7 which states that almost all observed data for a normal distribution (normal scattering of data) will fall within three standard deviations.
As such, for a data set that follows a normal distribution, 68% of data will fall within 1 standard deviation of the mean, while 95% of data for the normal distribution will fall within 2 standard deviations of the mean and 99.7% of data will fall within 3 standard deviations of the mean.
Hence, as the Bollinger bands are calculated using two standard deviations, we could expect RAD to abide within the Bollinger bands 95% of the time. (i.e. whenever the cryptocurrency touched the upper band, the chances of it coming down are 95%.). This concept applies vice-versa as well.
Moreover, the sections highlighted by red rectangles show how the bands expand and contract. When the bands widen, we could expect more volatility, and when the bands contract, it denotes less volatility. As the bands are widening currently, we could see a drastic change in prices.
Currently, the Bollinger bands are widening, hence RAD had an exponential rise. When considering this rise carefully, we could see that RAD was above the Upper band and at times was rebounding on it. However, that surge seems to have started to fade as RAD has formed a red candlestick. We could expect RAD to retrace further, as it is still not within the bounds of the Bollinger bands.
Sellers should keep an eye out for a sudden fall and make sure that they sell before their margin of profitability shrunk. On the other hand, buyers may want to wait until RAD hits rock bottom in order to buy the dip.
As such, traders should be vigilant about entering the market using the Bollinger bands. RAD could hit the SMA line and rebound or, it may fall to the lower band and then rebound. However, both of these present an excellent entry point. Hence, it is important that buyers time the market.
Notably, the Bollinger Band behaves very closely with the Keltner channel. For instance, if you were to use both the Bollinger bands and Keltner channel indicators for a cryptocurrency, you would see that almost most of the time both indicators overlap.
However, the only difference between with Bollinger band and the Keltner channel is that the Bollinger bands use Standard Deviation while the Keltner channel uses Average True Range for calculating its bands which are the top and bottom limits.
Radicle (RAD) Price Analysis – Relative Strength Index
The Relative Strength Index is an indicator that is used to find out whether the price of a security is overvalued or undervalued. As per its name, RSI indicators help determine how the security is doing at present, relative to its previous price.
Moreover, it has a signal line which is a Simple Moving Average (SMA) that acts as a yardstick or reference to the RSI line. Hence, whenever the RSI line is above the SMA it is considered bullish and if it’s below the SMA then it is bearish.
When considering the first green rectangle from the left of the chart below we can see that the RSI line (purple) is above the Signal line (yellow). As such, RAD is bullish or gaining value. Therefore it is reaching higher highs as shown in the chart.
The second green rectangle shows that the RSI is below the signal. Hence, RAD is bearish as it is making lower lows.
Currently, the RSI of RAD is in the overbought region registering a value of 78.57 and is tilting downwards. We could expect the RSI value to fall further and reach the Signal line. This could probably happen, since, the last time that RAD wandered into the overbought region it returned to the signal line at around 66. It could follow the same route this time again. But, how soon? is the question that lies answered.
To properly adjudicate this scenario, it is better for the investors to wait for the market to make a move, before making any vital moves. Furthermore, using another indicator or a combination of indicators for ensuring would be a smart option to look to.
To deduce whether a cryptocurrency is bearish or bullish, the RSI compares the gains of the securities against the losses it made in the past. This ratio of gains against the losses is then deducted from the 100.
If the answer is equal to or less than 30, then we call that the price of the security is in the oversold region.
This means that many are selling the security in the market, and as such the security is undervalued. Moreover, as per the Supply-demand curve theory, the price is supposed to drop when there is an increase in supply.
If the answer is equal to or greater than 70 then the security is overbought as many are buying. Since many want to buy the security the demand increases which intuitively increases the prices.
Additionally, the RSI could be used to determine how strong a trend is. For instance, when a cryptocurrency is bullish or reaching higher highs, then the RSI line also should be making higher highs in unison.
For instance, if the RSI is making lower highs when the cryptocurrency is making higher highs, then we may say that although the token/coin is on a bullish trend it is losing value. As such, there could be a trend reversal in the future.
However, the RSI could also give false alarms for breakouts. Although we may expect, the prices to retrace if it goes to the oversold or overbought region, the prices also can stay in the oversold or overbought region for an extended period. As such, traders should be wary of it and let the market saturate before making vital decisions.
Radicle (RAD) Price Analysis – Moving Average
The Exponential Moving averages are quite similar to the simple moving averages (SMA). However, the SMA equally distributes down all values whereas the Exponential Moving Average gives more weightage to the current prices. Since SMA undermines the weightage of the present price, the EMA is used in price movements.
The 200-day MA is considered to be the long-term moving average while the 50-day MA is considered the short-term moving average in trading. Based on how these two lines behave, the strength of the cryptocurrency or the trend can be determined on average.
In particular, when the short-term moving average (50-day MA) approaches the long-term moving average (200-day MA) from below and crosses it, we call it a Golden Cross.
Contrastingly, when the short-term moving average crosses the long-term moving average from above then, a death cross occurs.
Usually, when a Golden Cross occurs, the prices of the cryptocurrency will shoot up drastically, but when there’s a Death Cross, the prices will crash.
Whenever the price of cryptocurrency is above the 50-day or 200-day MA, or above both we may say that the token is bullish (red elliptical). Contrastingly, if the token is below the 50-day or 200-day, or below both, then we could call it bearish (Green triangle section).
We could see that RAD tested the 50-day MA on numerous occasions but wasn’t able to break above it. Had investors taken the false buy signal hoping for RAD to break out the 50-day MA and 200-day MA then they would have made a loss. However, the dawn of 2023 seems to have brought a glimmer of hope for RAD.
Unlike a conventional Golden Cross that produces a sudden spike, RAD started crashing after the Golden Cross. The 200-day MA swapped places with the 50-day MA. As such, RAD which was rebounding on the 200-day MA has started rebounding on the 50-day MA after it took the 200-day MA’s place.
Since the 50-day MA seems to be a good Support, RAD may seek the assistance of the 50-day MA in the event the bears pull RAD down.
Radicle (RAD) Price Analysis – Rate of Change
The Rate of Change Indicator is a momentum oscillator, that measures the change of the current price against the past price a few (n) periods ago, in percentage. As long as the price is rising ROC will be positive. But, the ROC indicator will reach the negative zone when the prices reduce. Increasing values in either direction, positive or negative, indicate increasing momentum and moving back toward zero indicates diminishing momentum.
Moreover, the equation for ROC is as follows: ROC = [(Today’s Closing Price – Closing Price n periods ago) / Closing Price n periods ago] x 100.
Unlike the RSI, ROC has no set overbought or oversold regions, it rather depends on a trader’s discretion. Traders often tend to find the areas in the positive and negative zones where the trend changes have happened in regularity. Based on this they could mark their bounds for overbought and oversold regions.
ROC could also be used as a divergence indicator that signals a possible upcoming trend change. Divergence occurs when the price of a stock or asset moves in one direction while its ROC moves in the opposite direction.
For example, if a stock’s price is rising over a period of time and registering higher highs while the ROC is progressively moving lower, or making lower highs, then the ROC is indicating bearish divergence from price, which signals a possible trend change to the downside. The same concept applies if the price is moving down and ROC is moving higher.
Additionally, the zero line crossover could be used to signal trend changes. However, depending on the number used for n (periods) in the indicator the signals may come in early or late.
When considering the chart we could see that RAD was making lower highs and lower lows in unison with the ROC. It could be because we are using the 9 for the length in the indicator. Hence, there seems to be no divergence.
Moreover, RAD’s extremely overbought regions are marked as Overbought Region 1 at 24.10, Overbought Region 2 at 68.06, and Overbought Region 3 at 129.31. RAD’s trend reversed many times after it reached the overbought region 1. Furthermore, we could see higher the overbought region lesser the number of times RAD tested those levels.
Similarly, RAD reached the Oversold Region 1 at -24.99 many times as compared to the Oversold Region 2 at -55.77.
Currently, the ROC indicates a value of 104.26 and is extremely overbought, hence, we could expect the prices to decrease further.
Radicle (RAD) Price Prediction 2023-2030 Overview
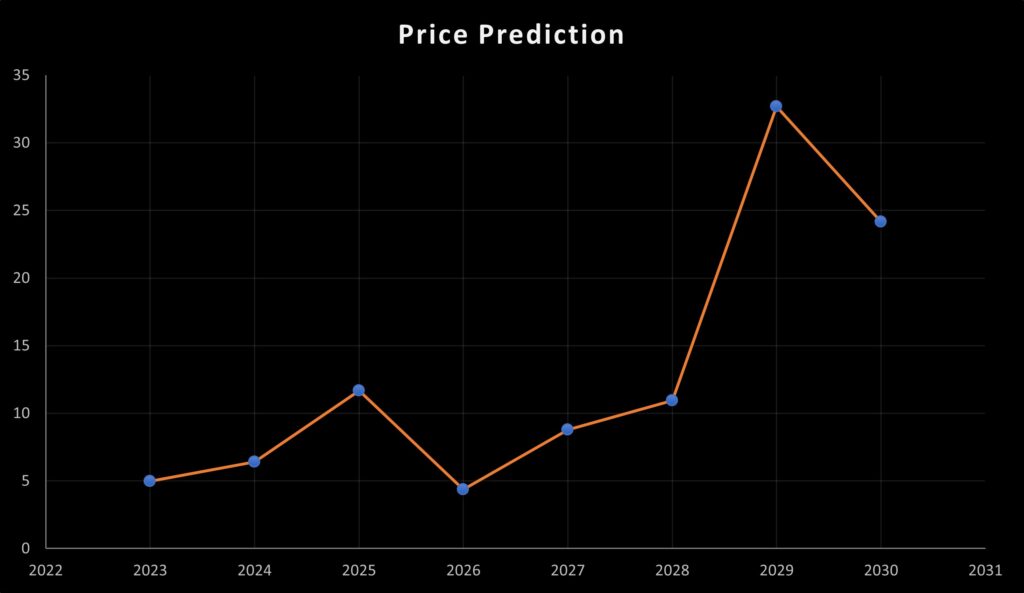
| Year | Minimum Price | Average Price | Maximum Price |
| 2023 | $2.235 | $4.991 | $5.894 |
| 2024 | $5.912 | $6.42 | $8.51 |
| 2025 | $10.52 | $11.671 | $12.89 |
| 2026 | $3.31 | $4.36 | $5.78 |
| 2027 | $7.79 | $8.788 | $9.25 |
| 2028 | $9.89 | $10.95 | $11.59 |
| 2029 | $30.19 | $32.675 | $34.25 |
| 2030 | $22.35 | $24.15 | $25.16 |
| 2040 | $54.08 | $56.04 | $57.32 |
| 2050 | $86.35 | $87.92 | $89.12 |
Radicle (RAD) Price Prediction 2023
When considering the chart above we could see that RAD was consolidating between Resistance B at $2.337 and Support 2 at $1.500 since March 2022. However, RAD occasionally broke Resistance B and hit Resistance A at $2.717.
Although RAD is placed at $3.370 at present, this is no familiar territory for Radicle, hence we could expect the prices to move either way. However, when considering the Bollinger bands we could derive that RAD may reduce in value in the future. As such, we could expect Radicle to reach Support 1 at $1.902.
In the event that RAD’s fall is not supported by Support 1, it may seek to land on Support 2 $1.500. From Support 2, there’s a possibility that RAD could reach Resistance B at $2.337. With more support from the bulls, it could reverb break Resistance A which isn’t that strong. If RAD breaks Resistance A it could reach $4.791.
On the other hand, if RAD’s fall is Supported at Support 1, then RAD would test Resistance A and B first and then it could test the present value of $3.5.
Although the chances of RAD fluctuating directly without reaching Support levels seem quite slim, Radicle has the possibility of reaching Resistance 1 at $6.012, as its volatility is extremely high. As such traders should be vigilant.
Radicle (RAD) Price Prediction – Resistance and Support Levels
When looking at the chart above we could see that RAD was descending taking the form of a mirror image of an exponential rise. From November 2021 to May 2022 Radicle was falling making lower highs. However, when considering the November 2021 to Jan 2022 time span, we could see that RAD tried to consolidate between Resistance 4 and Resistance 2 but it was unable as the bears were too strong.
Thereafter the bears pulled RAD from Resistance 3 to below Resistance 1. Even during the phase, where RAD was below Resistance 1, we could some consolidation as RAD was not making lower lows. However, that too came to nothing, when the bears pulled RAD further into the mire. This made Radicel reach Support 1. And since it reached Support 1, RAD has been heavily dependent on it. The Bulls will need something special to make Radicle move to Reistance 1 again.
Radicle (RAD) Price Prediction 2024
There will be Bitcoin halving in 2024, and hence we should expect a positive trend in the market due to user sentiments and the quest by investors to accumulate more of the coin. Since the Bitcoin trend affects the direction of trade of other cryptocurrencies, we could expect RAD to trade at a price not below $6.42 by the end of 2024.
Radicle (RAD) Price Prediction 2025
RAD may still experience the after-effects of the Bitcoin halving and is expected to trade above its 2024 price. Many trade analysts speculate that BTC halving could create a huge impact on the crypto market. Moreover, similar to many altcoins, RAD will continue to rise in 2025 forming new resistance levels. It is expected that RAD would trade beyond the $11.67 level.
Radicle (RAD) Price Prediction 2026
It is expected that after a long period of bull run, the bears would come into power and start negatively impacting the cryptocurrencies. During this bearish sentiment, RAD could tumble into its support regions. During this period of price correction, RAD could lose momentum and be a little below its 2025 price. As such it could be trading at $4.36 by 2026.
Radicle (RAD) Price Prediction 2027
Naturally, traders expect a bullish market sentiment after the crypto industry was affected negatively by the bears’ claw. Moreover, the build-up to the next Bitcoin halving in 2028 could evoke excitement in traders. As such we could expect RAD to trade at around $8.78 by the end of 2027.
Radicle (RAD) Price Prediction 2028
As the crypto community’s hope will be re-ignited looking forward to Bitcoin halving like many altcoins, RAD will continue to form new higher highs and is expected to move in an upward trajectory. Hence, RAD would be trading at $10.95 after experiencing a massive surge by the end of 2028.
Radicle (RAD) Price Prediction 2029
2029 is expected to be another bull run due to the aftermath of the BTC halving. However, traders speculate that the crypto market would gradually become stable by this year. In tandem with the stable market sentiment and the slight price surge expected after the aftermath, RAD could be trading at $32.67 by the end of 2029.
Radicle (RAD) Price Prediction 2030
After witnessing a bullish run in the market, RAD and many altcoins would show signs of consolidation and might trade sideways and move downwards for some time while experiencing minor spikes. Therefore, by the end of 2030, RAD could be trading at $24.15.
Radicle (RAD) Price Prediction 2040
The long-term forecast for RAD indicates that this altcoin could reach a new all-time high(ATH). This would be one of the key moments as HODLERS may expect to sell some of their tokens at the ATH point.
However, RAD may face a slight fall before starting its upward journey once again. It is expected that the average price of RAD could reach $56.04 by 2040.
Radicle (RAD) Price Prediction 2050
The community believes that there will be widespread adoption of cryptocurrencies, which could maintain gradual bullish gains. By the end of 2050, if the bullish momentum is maintained, RAD could hit $87.92.
Conclusion
If investors continue to show interest in RAD and add these tokens to their portfolio, then, it could continue to rise up. RAD’s bullish price prediction shows that it could reach the $5 level.
FAQ
Radicle is a sovereign peer-to-peer network for code collaboration, built on top of Git, a source code management repository
RAD can be traded on many exchanges like Binance, Mandala Exchange, Huobi Global, Crypto.com Exchange, and Gate.io.
RAD has a possibility of surpassing its present all-time high (ATH) price of $27.35 in 2021.
RAD is one of the few cryptocurrencies that has retained its bullish momentum in the past seven days. If this momentum is maintained, RAD might reach $5 soon after its breaks Resistance A and B levels.
RAD has been one of the most suitable investments in the crypto space. It has been rising exponentially, hence, traders may be allured to invest in RAD.
RAD has a present all-time low price of $1.3527.
Radicle was developed by Monadic, a Berlin-based software company working on open-source software collaboration. Monadic is headed by Alexis Sellier and Eleftherios Diakomichalis.
Maximum supply of RAD is 99,999,620 RAD coins.
RAD can be stored in a cold wallet, hot wallet, or exchange wallet.
RAD is expected to reach $ 6.42 by 2024.
RAD is expected to reach $11.67 by 2025.
RAD is expected to reach $4.36 by 2026.
RAD is expected to reach $10.95 by 2028.
RAD is expected to reach $32.67 by 2029.
RAD is expected to reach $24.15 by 2030.
RAD is expected to reach $56.04 by 2040.
RAD is expected to reach $87.92 by 2050.
Disclaimer: The views and opinions, as well as all the information shared in this price prediction, are published in good faith. Readers must do their research and due diligence. Any action taken by the reader is strictly at their own risk. Coin Edition and its affiliates will not be held liable for any direct or indirect damage or loss.
Disclaimer: The information presented in this article is for informational and educational purposes only. The article does not constitute financial advice or advice of any kind. Coin Edition is not responsible for any losses incurred as a result of the utilization of content, products, or services mentioned. Readers are advised to exercise caution before taking any action related to the company.


