


- Tokens could fuel market volatility, impacting the prices of RNDR and other tokens.
- RNDR’s recent rally suggests positive sentiment, but conflicting technical signals pose uncertainty.
- Daily linear unlocks may pressure token prices downwards, depending on market demand.
Render (RNDR) investors brace themselves for a big thing as almost $7.14 million in tokens are expected to be unlocked. This impending unlock has ignited speculation within the crypto community, prompting questions about whether this will lead to a pump or dump scenario for the RNDR token. The unlock is part of a larger trend in the crypto market where token unlocks can have a substantial impact on price dynamics.
In the next seven days, a total of $386.04 million worth of tokens will be unlocked, with the top three tokens being ARB, AXS, and IMX. Thus, these unlocks implicate a substantial percentage of each token’s total supply, giving rise to fears of market instability. Additionally, linear unlocks occur daily, further adding to the overall token supply entering the market.
Among the tokens experiencing linear unlocks, WLD, SOL, and AVAX are leading the pack in terms of daily unlock value. This gradual release of tokens can exert downward pressure on prices as supply increases over time. However, the extent of this impact depends on various factors, such as market sentiment and demand for the tokens.
Despite the uncertainty surrounding the unlock events, RNDR has seen a notable rally of 18%, with its price reaching $9.28. This surge in price could be attributed to a variety of factors, including positive sentiment within the crypto community and bullish technical signals. The 1-Day Stochastic RSI reading above the signal line suggests a potential bullish signal in the short term, although traders may seek confirmation from other indicators.
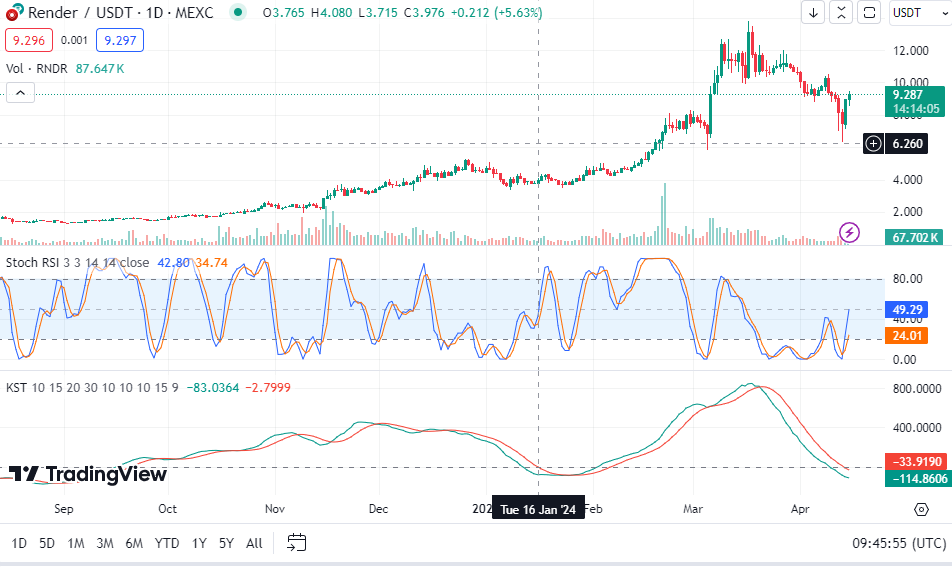
Render/USD 1-Day price chart, Source: Trading view
On the other hand, the 1-day MACD trading below the signal line takes the shape of a bearish short-term signal, which shows the conflicting signals in the current market. Furthermore, the 1-day KST trading below the signal line points towards a potential bearish trend in the short term, adding another layer of uncertainty for traders to consider.
Disclaimer: The information presented in this article is for informational and educational purposes only. The article does not constitute financial advice or advice of any kind. Coin Edition is not responsible for any losses incurred as a result of the utilization of content, products, or services mentioned. Readers are advised to exercise caution before taking any action related to the company.


