


 Token Records 52-Week High Amid Bullish Surge")
- RNDR’s bullish surge to $4.00 signals growing investor interest and potential for further gains in the market.
- MACD and MFI indicators point to strengthening RNDR momentum, likely making a breakthrough above $4.16.
- With RSI and BBP favoring buyers, RNDR’s positive market sentiment suggests more upside potential.
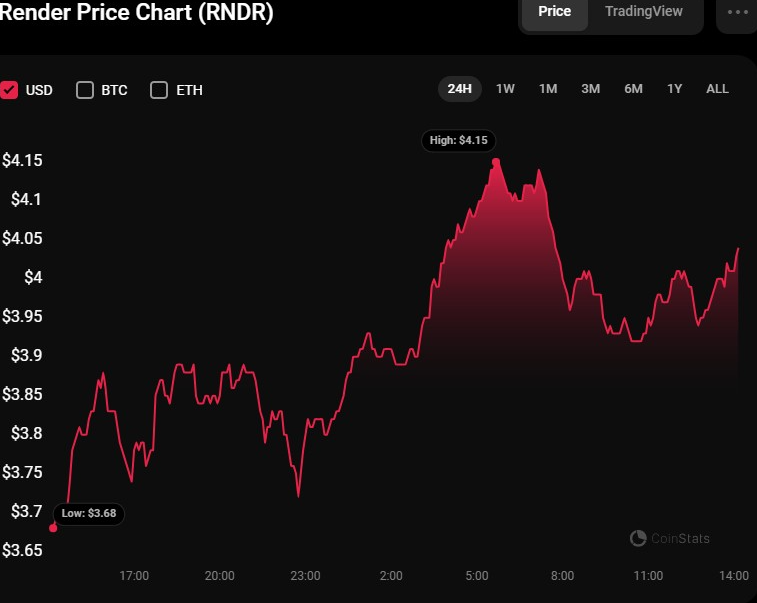
Bullish momentum has prevailed in the Render (RNDR) market, with prices jumping from an intraday low of $3.63 to a 52-week high of $4.16 before a modest pullback. RNDR was trading at $4.00 at press time, representing a 10% increase from its intraday low. The price increase in RNDR can be due to increased investor demand and improved market sentiment.
During the bull run, RNDR’s market capitalization and 24-hour trading volume increased by 9.95% and 104.69%, respectively, to $1,486,173,912 and $232,854,343. This increase in market capitalization and trading volume reflects increased investor interest and trust in the RNDR market.
If this bullish momentum breaks through the intraday $4.16 resistance, the next level to monitor for RNDR is around $4.50. Breaking through this level suggests a strong bullish trend and attracts more investors, opening up greater upside potential for the cryptocurrency. If the price fails to break above the $4.16 resistance level, the next support level for RNDR to watch is around $3.80.
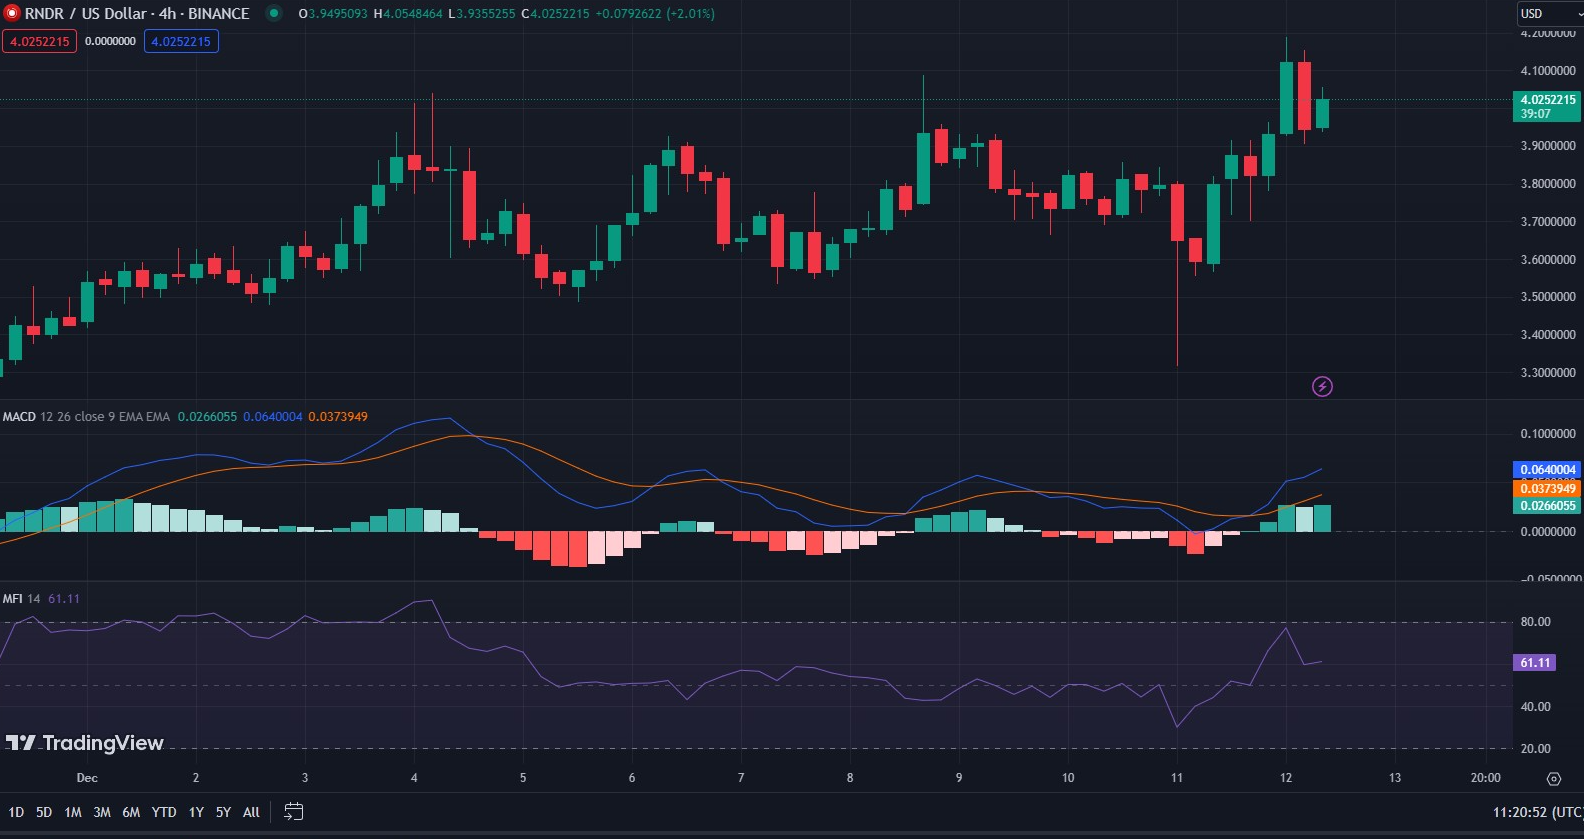
The Moving Average Convergence Divergence (MACD) rating of 0.0647394 and movement in the positive region indicate that the RNDR market is now experiencing bullish momentum. This trend might pique investor interest and drive the price past the $4.16 barrier. Furthermore, the MACD histogram is growing, indicating a strengthening bullish momentum.
The Money Flow Index (MFI) rating of 61.11 indicates that the RNDR market is under moderate purchasing pressure. This MFI rating shows a reasonable level of demand for RNDR, which might help support and potentially drive up its price. In addition, the MFI being above 50 indicates that buyers are more prominent in the market than sellers, maintaining the positive momentum in RNDR. However, if the MFI rating falls below 50, it may suggest a shift in market sentiment and, as a result, a decline in buying demand for RNDR.
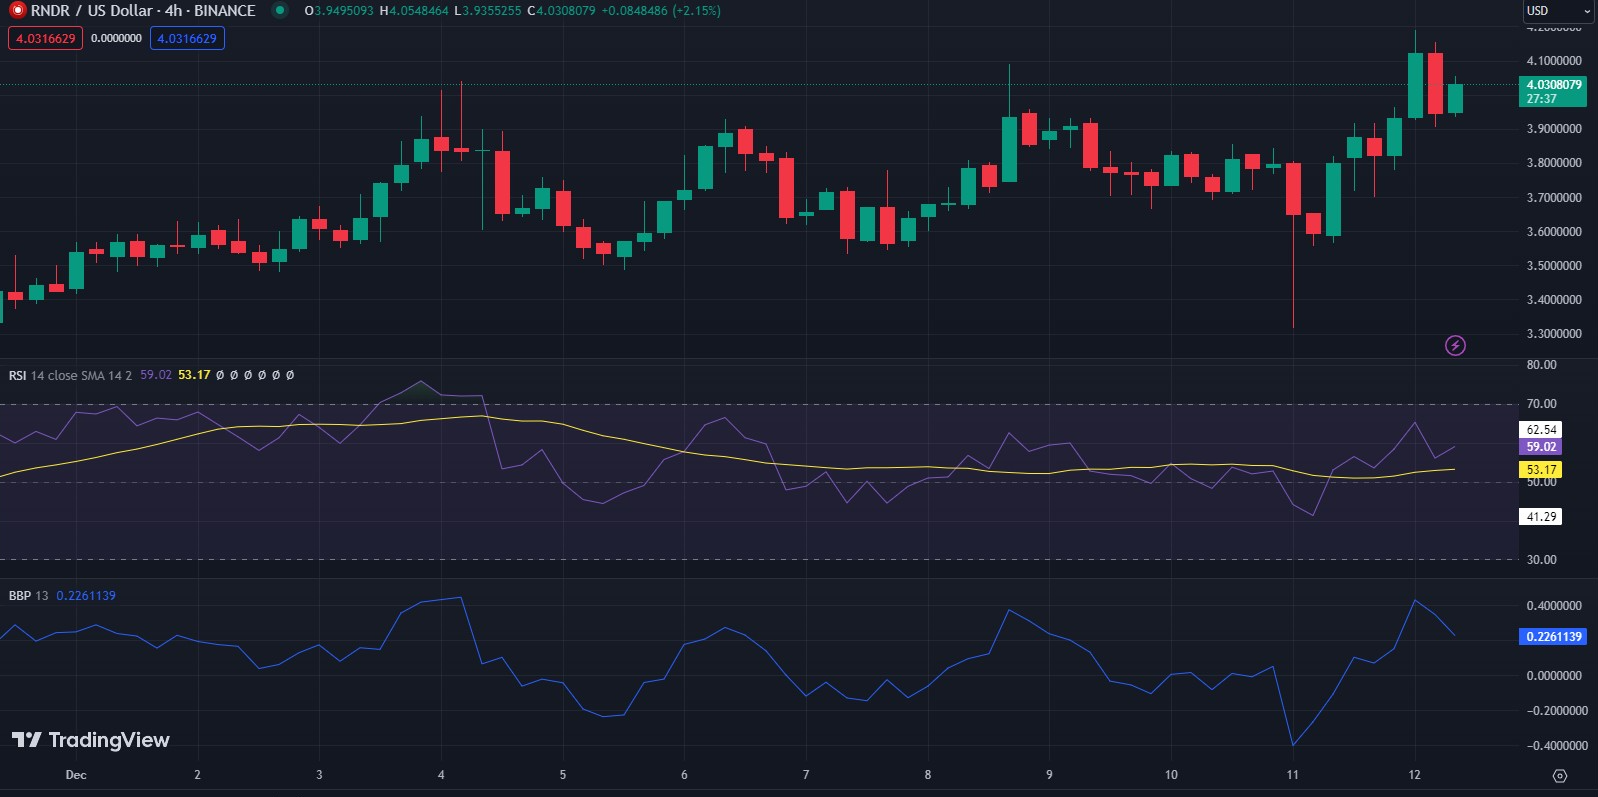
The RNDR/USD’s Relative Strength Index (RSI) rating of 59.04 adds to the market’s modest buying pressure. The fact that the RSI is above 50 means that the current rise in RNDR will likely continue, as it indicates that purchasing strength outweighs selling pressure. The rising trend of the RSI also shows that buying pressure for RNDR is progressively building.
Furthermore, the positive Bull Bear Power (BBP) motion with a rating of 0.2260166 underlines purchasing pressure in the RNDR market. The bullish BBP movement indicates that bulls are in control and that RNDR prices are more likely to continue rising. A modest RSI rating and positive BBP movement imply an intense market mood for RNDR, which could attract additional buyers and increase prices.
In conclusion, RNDR’s bullish surge reflects growing investor interest and positive market sentiment, with potential for further gains if it breaks the $4.16 resistance level.
Disclaimer: The information presented in this article is for informational and educational purposes only. The article does not constitute financial advice or advice of any kind. Coin Edition is not responsible for any losses incurred as a result of the utilization of content, products, or services mentioned. Readers are advised to exercise caution before taking any action related to the company.


 Price Prediction 2026, 2027, 2028, 2029, 2030-2050")