


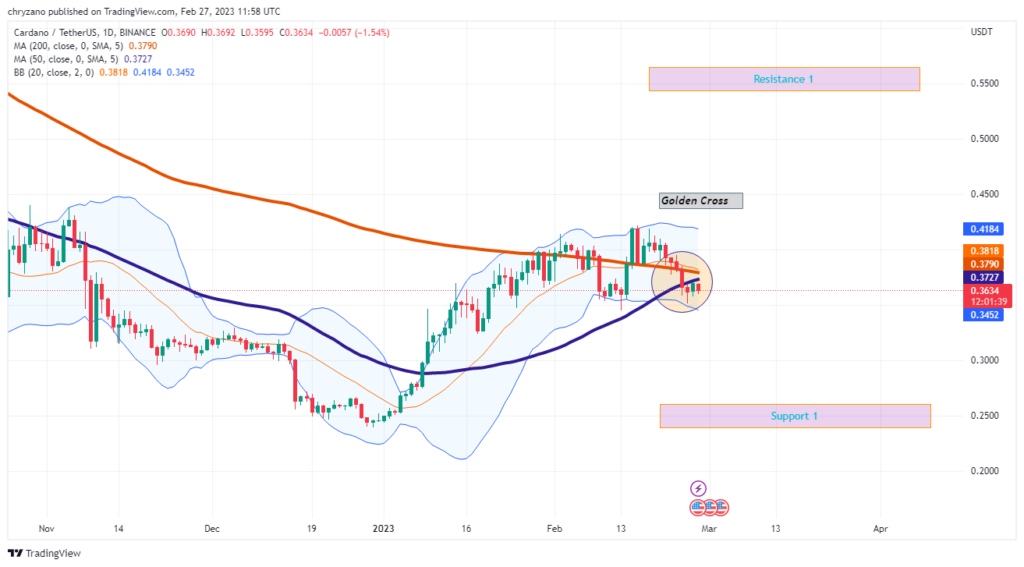
- News platform tweets that ADA could expect a reversal if bulls defend the $0.36 support level.
- ADA formed consecutive Golden Crosses in 2020. The present emits similarities to the 2020 Cross.
- The time period between two consecutive golden crosses was 100 days. There could be another Golden Cross for ADA.
Cardano Feed, a news analysis platform that reports Cardano (ADA) news tweeted that “Cardano can expect a reversal if bulls defend this price zone [$0.363].” Although Cardano tested the $0.363 support level from February 9 to 11, the bulls were able to defend this support zone and push the prices up. However, currently, ADA is testing this support level once again.
There seems to be some good news for the ADA on the horizon as the formation of a golden cross could be spotted. The 50-Day MA is approaching the 200-Day MA from below and if these two lines intersect at any given time, a Golden Cross could happen and ADA could go up drastically.
Nonetheless, there seems to be no change in the width of the Bollinger bands as expected. The Bollinger bands for ADA are not widening, which indicates that its price is currently not shooting up. However, ADA has touched the lower Bollinger band, hence, the prices could surge in the future, but the question is will it surge as expected after a Golden Cross?
So to build up the case for ADA’s behavior after a Golden, we will consider the previous Golden in 2020. In 2020, February and May ADA had two consecutive Golden Crosses. During its first Golden Cross as shown in the chart, the Bollinger bands had no change: neither contraction nor expansion. In spite of surging after the Golden Cross, ADA’s price started decreasing after hitting the upper Bollinger band.
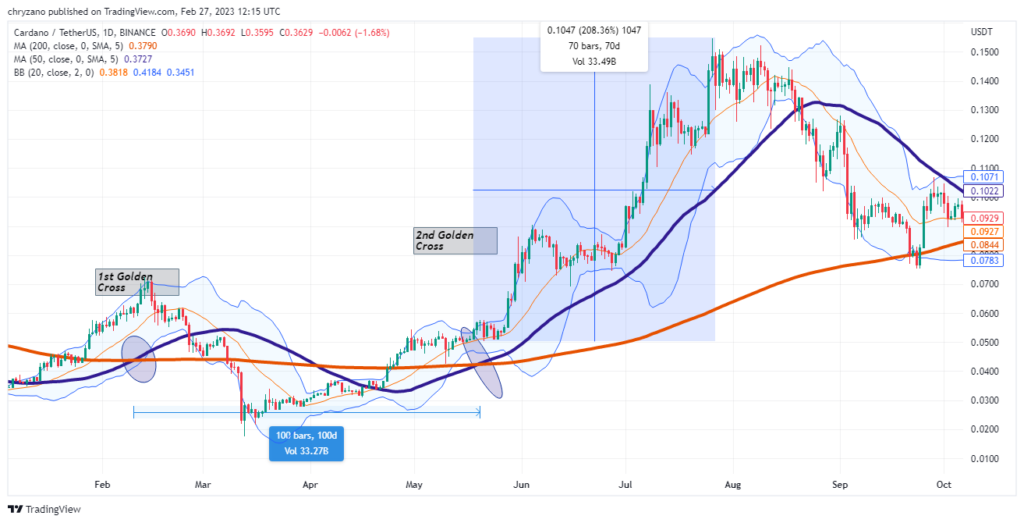
When considering the second Golden Cross in the chart, the Bollinger bands contracted after ADA formed the Cross. Nonetheless, the second Golden ramped ADA’s price up by 208% in the span of 70 days. Moreover, the time period between the first and the second Golden cross was approximately 100 days.
When we compare the first Golden cross in February 2020 to the presently forming golden cross, there is a similarity we could spot. Both the crosses had no change in their Bollinger bands. So the question is, is ADA imitating the first Golden Cross it formed in 2020? If that is the case, these are some of the questions that traders may need to consider — One, is there yet again another cross that will be followed after this presently forming cross? Two, if by any chance the second cross is formed, will ADA increase by 208% as it did in 2020?
As the case for ADA is choc-a-block full of uncertainty it would be wise if traders would hold their horses before deriving a conclusion, as another Golden Cross could be on the horizon. Hence, a wait of approximately 100 days could help traders hit the jackpot if ADA reciprocates its second Golden Cross in 2020.
Disclaimer: The views and opinions, as well as all the information shared in this price analysis, are published in good faith. Readers must do their own research and due diligence. Any action taken by the reader is strictly at their own risk, Coin Edition and its affiliates will not be held liable for any direct or indirect damage or loss.
Disclaimer: The information presented in this article is for informational and educational purposes only. The article does not constitute financial advice or advice of any kind. Coin Edition is not responsible for any losses incurred as a result of the utilization of content, products, or services mentioned. Readers are advised to exercise caution before taking any action related to the company.


