


- SHIB tanks to the red zone instantly after the market opened for trading and reached $0.000008741, the lowest.
- Bulls keep bears at bay after a hard-fought tussle at the beginning of the week.
- Shiba Inu reciprocates the RSI by setting lower highs.
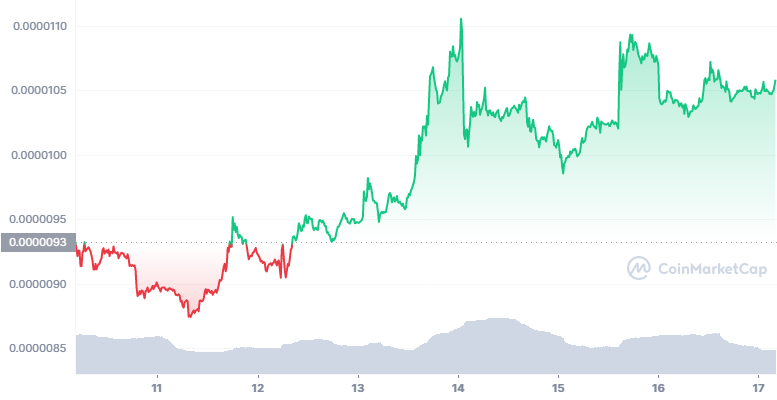
Shiba Inu (SHIB) had a gloomy start to the week trading at $0.0000093 as shown in the chart below. Instantly after the trading began for the week, SHIB tanked into the red zone. The token was in the red zone for almost a quarter of the second day. SHIB reached its lowest price of $0.000008741 for the week on the first day of the week.
After its brief stay in the red zone, the bulls pulled SHIB into the green zone. Ever since the bulls started the rally, the bears have been kept at bay. During the initial stages of being in the green zone, SHIB struggled to gain momentum. However, towards the end of the third day, the bulls ran rampant. SHIB reached a maximum of $0.00001106 on the fourth day of the week.
Currently, Shiba Inu is up by 1.43% in the last 24 hours and is priced today at $0.000011 with a 24-hour trading volume of $278,574,549. Furthermore, it ranks at 15 with a live market cap of $5,804,729,945 USD.
Shiba Inu has risen exponentially as shown in the chart below. Despite SHIB touching the upper Bollinger band on multiple occasions and the market correcting it, Shiba Inu is in an unstoppable role. Currently, after hitting the upper Bollinger band the market has corrected the prices and SHIB seems to be moving sideways.
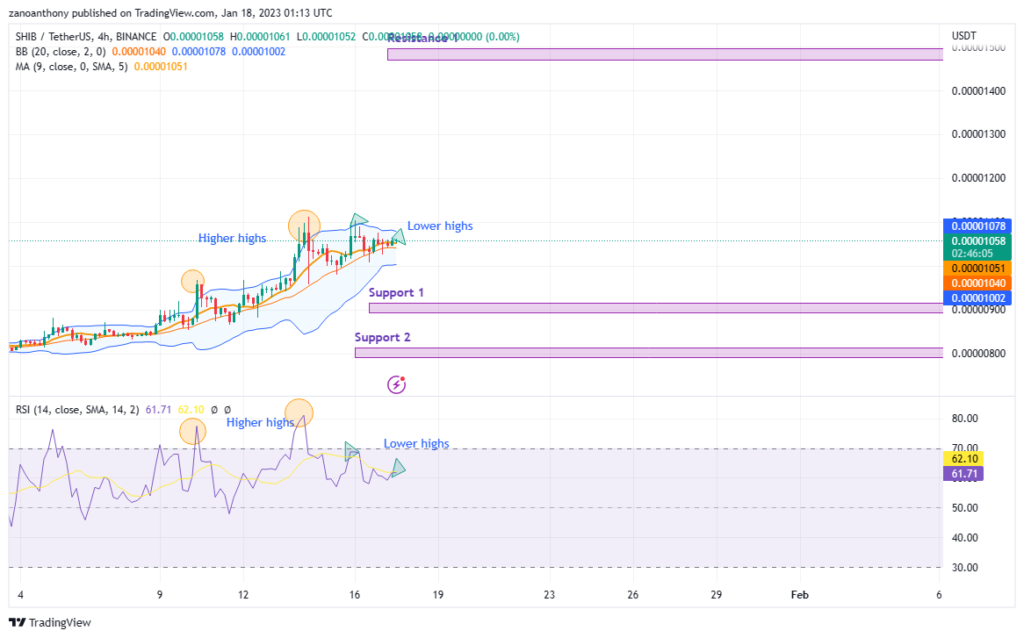
But this could be the stage where SHIB is consolidating before surging and touching the upper Bollinger band similar to previous times. The RSI is based at 60.60, hence the market is neither overbought nor oversold.
Meanwhile, SHIB was reaching higher-highs simultaneously with the RSI in the past as shown in the chart (circles). However, SHIB is currently descending and reaching lower highs with the RSI reciprocating it. Hence, there could be a bearish sentiment on the horizon.
If the bears take over the market, SHIB could tank to Support 1. With more pressure from the bears, it could even drop to Support 2. Contrastingly, if the bulls dominate, Shiba Inu could reach resistance 1, although the climb could be stifling.
Disclaimer: The views and opinions, as well as all the information shared in this price analysis, are published in good faith. Readers must do their own research and due diligence. Any action taken by the reader is strictly at their own risk, Coin Edition and its affiliates will not be held liable for any direct or indirect damage or loss.
Disclaimer: The information presented in this article is for informational and educational purposes only. The article does not constitute financial advice or advice of any kind. Coin Edition is not responsible for any losses incurred as a result of the utilization of content, products, or services mentioned. Readers are advised to exercise caution before taking any action related to the company.


