


- Crypto analyst tweeted that SHIB was breaking upside from its descending channel.
- SHIB takes a false start but recovers well toward the end of the week
- Left shoulder of SHIB sets lower lows while its right shoulder consolidates.
Crypto Analyst and Trader Captain Faibik tweeted that Shiba Inu (SHIB) was breaking upside from its descending channel. Moreover, he stated, “C’mon Bulls, Send it to the Mars,” reciprocating the bulls to drive SHIB higher. The analyst predicted that SHIB had the potential to go up by 280.94% and reach $0.00002579.
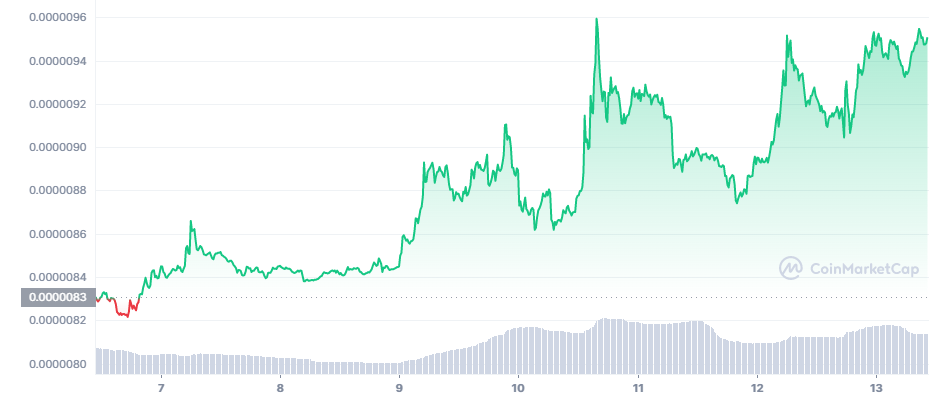
When considering the seven-day chart below, SHIB took a false start as it delved into the red zone instantly after the market opened for trading. On its way into the red zone, Shiba Inu reached its lowest of $0.00008226 on the first day of the week.
However, in the course of the next two days, the bulls came to SHIB’s rescue and pulled it into the green zone. Although the bulls were able to help SHIB reach the green zone, the bears didn’t let the bulls run rampant. As such, SHIB fluctuated in a tight range between $0.000084 – $0.000086 for the second and third days of the week.
Come the fourth day of the week, the bears could not contend with the bull’s pressure. SHIB broke out from its confined movements and started fluctuating with more amplitude. On its triumphant march, SHIB reached its highest of $0.000096. Currently, SHIB is trading at $0.000010 up by 3.21% in the last 24 hours.
SHIB has been fluctuating in a descending channel. Notably, SHIB tested the 200-day MA when forming both, the left and right shoulder. The median line of the regression trend channel denotes the inclined neckline. Although the left shoulder had lower lows, Shiba Inu neither did reach lower lows or higher highs on the right shoulder, as it was consolidating.
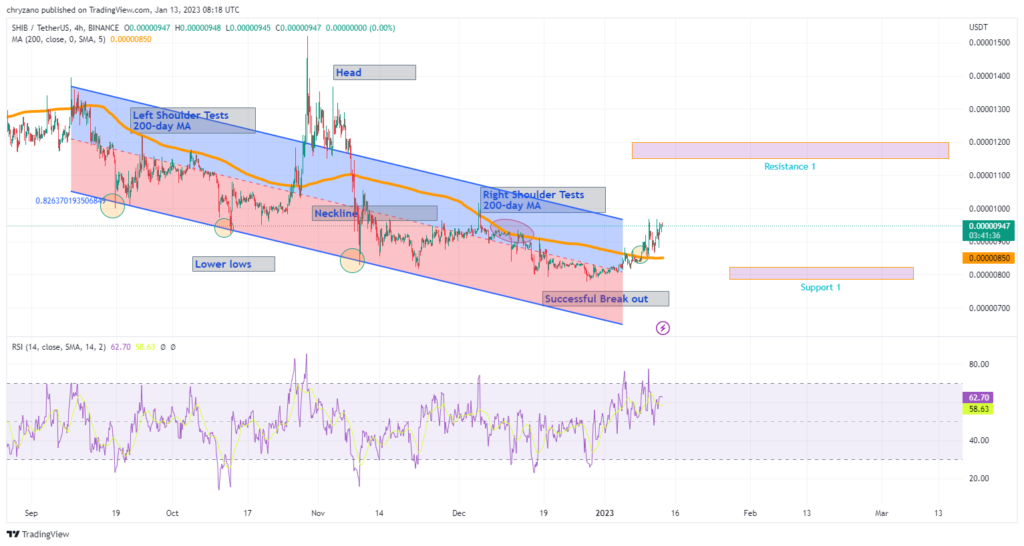
After testing the 200-day MA on its right shoulder, SHIB has broken out of the 200-day MA. If the bull pushes hard, Shiba Inu could be forming the next head when it reaches resistance 1 (≈$0.000012) or maybe even higher as predicted by Faibik at $0.00002579. Contrastingly, if the bears take over the market, SHIB could tank to support 1 (≈$0.000008).
Disclaimer: The views and opinions, as well as all the information shared in this price analysis, are published in good faith. Readers must do their own research and due diligence. Any action taken by the reader is strictly at their own risk, Coin Edition and its affiliates will not be held liable for any direct or indirect damage or loss.
Disclaimer: The information presented in this article is for informational and educational purposes only. The article does not constitute financial advice or advice of any kind. Coin Edition is not responsible for any losses incurred as a result of the utilization of content, products, or services mentioned. Readers are advised to exercise caution before taking any action related to the company.

 Price Prediction 2026-2030: Will LTC Hit $80 Soon?")


 Price Prediction 2026, 2027, 2028, 2029, 2030-2050")