


- Shiba Inu price analysis shows an uptrend at $0.0000113 after a recent surge.
- The digital asset value has risen more than 2.76% over the past 24 hours.
- The support level for the cryptocurrency is seen at $0.00001092.
The most recent Shiba Inu price analysis shows a bullish trend in digital assets and is currently trading at the $0.0000113 mark. Recently, the cryptocurrency has gained over 2.76% in the past 24 hours and has seen an increase in demand as investors look to benefit from its high potential. The SHIB/USD pair is currently trading above the $0.00001092 support level and is looking to rise further as it continues its uptrend.
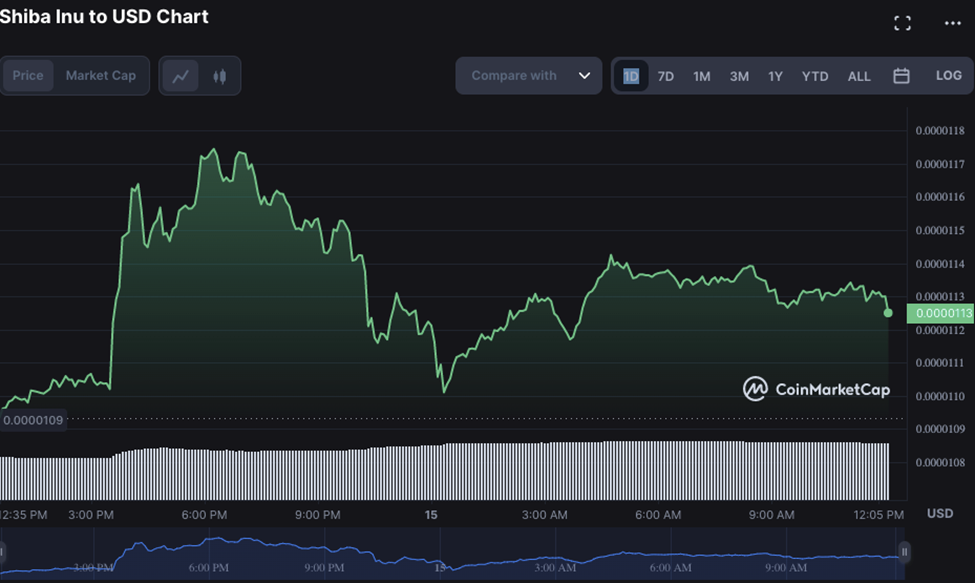
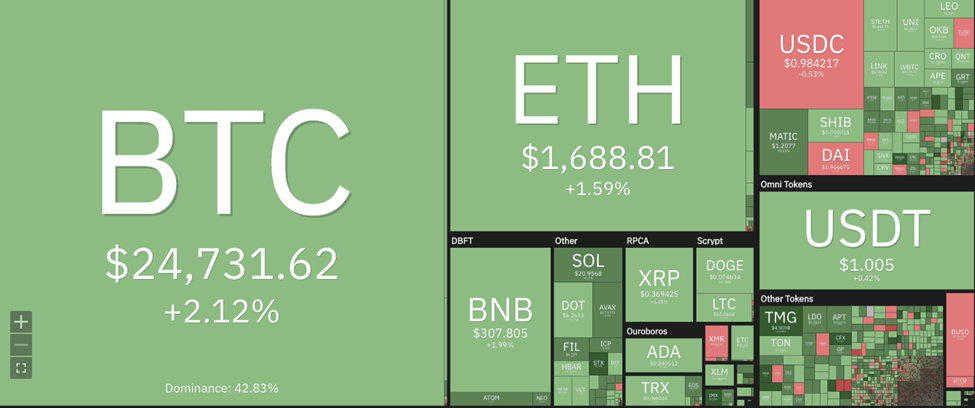
The Shiba Inu market cap stands at almost $6.18 billion, increasing by 2.85% over the past 24 hours and making it one of the largest digital assets in terms of market capitalization, while the 24-hour trading volume is recorded at over $501 million. The circulating supply of SHIB tokens is currently 549,063,278,876,302 SHIB, according to CoinMarketCap.
Looking ahead, Shiba Inu is expected to remain bullish, and the price could possibly reach the $0.00001177 resistance level in the near future if the current momentum continues. However, any sudden volatility in the digital asset market could affect the price of SHIB and cause it to fall below the $0.00001092 support level, which could lead to further consolidation.
The previous week the market for SHIB was bearish as the digital asset saw a dip in price below the $0.0000977 level, as the selling pressure increased. However, the digital asset recovered quickly and is now trading above the $0.00001092 level as bullish sentiment continues to be dominant in the market.
Looking at the latest technical indicators, the Relative Strength Index (RSI) stands at 57.35 and indicates a neutral market condition. The Moving Average Convergence/ Divergence (MACD) suggests that the market is running bullish and that the SHIB coin could see further gains shortly. The green bars in histograms also indicate a bullish trend in the digital asset market.
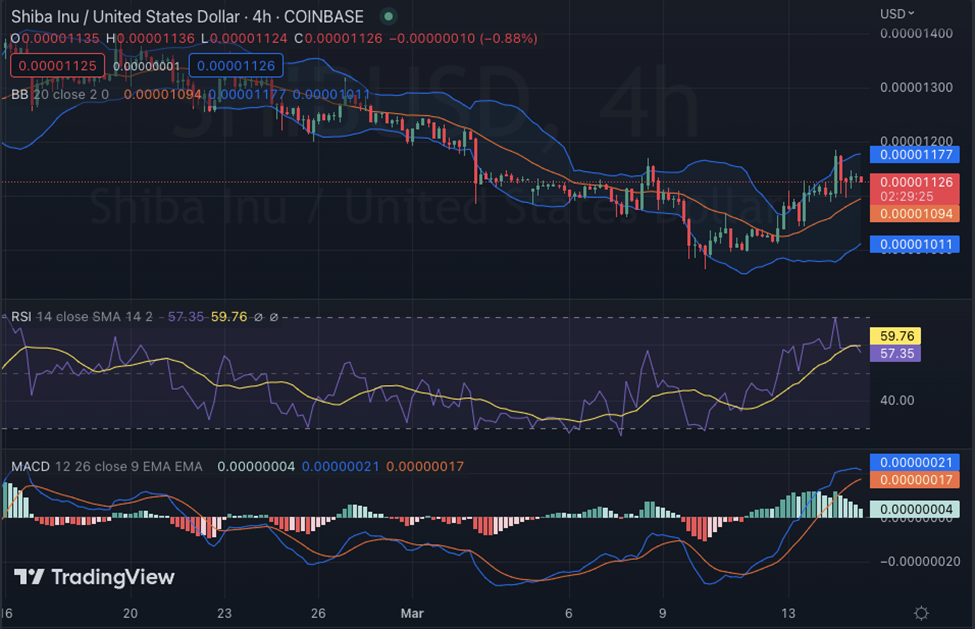
The Bollinger bands on the 4-hour chart are widening, indicating that there will be volatility in the market. The upper Bollinger band at $0.00001178 which could be a possible resistance level for the digital asset, while the lower Bollinger band stands at $0.00001092 which could be a possible support level for SHIB in the coming days.
To sum up, Shiba Inu has seen an impressive run-up in the recent past and is expected to remain bullish. The buying pressure is likely to remain strong as long as the digital asset market continues to show positive sentiment. The bulls are likely to continue pushing prices toward the $0.00001177 resistance level, which could open doors for further gains in the near future.
Disclaimer: The views and opinions, as well as all the information shared in this price analysis, are published in good faith. Readers must do their own research and due diligence. Any action taken by the reader is strictly at their own risk, Coin Edition and its affiliates will not be held liable for any direct or indirect damage or loss.
Disclaimer: The information presented in this article is for informational and educational purposes only. The article does not constitute financial advice or advice of any kind. Coin Edition is not responsible for any losses incurred as a result of the utilization of content, products, or services mentioned. Readers are advised to exercise caution before taking any action related to the company.
 Price Prediction 2026, 2027, 2028, 2029, 2030 -2050")


