
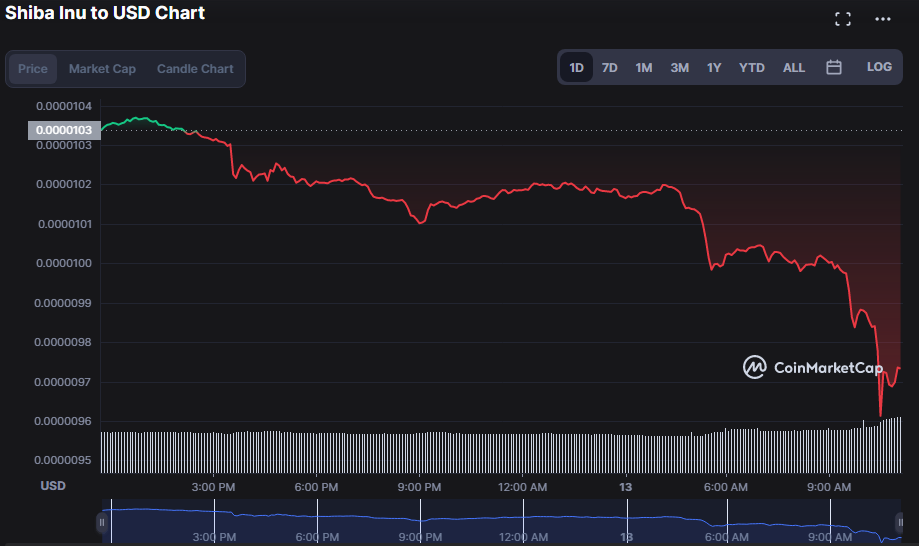
- The pricing analysis for Shiba Inus shows a significant drop.
- To buck the present trend, bulls must maintain the resistance level.
- The SHIB price retraced 7.29 % to $$0.000009479.
Shiba Inu price research indicates that SHIB has fallen significantly during the past 24 hours. From its high of $0.00001037 to its current price of $0.000009479, it has undergone a retracement. SHIB experienced a 7.29% decline during the slump, reaching a low of $0.000009385.
Shiba Inu’s market capitalization is at $5,345,435,894, 5.82% down, but trading volume has increased by 36.20%, reaching $189,127,964.
The shrinking of the Bollinger bands suggests that the market is not particularly volatile. The top band is at 0.00001094 and 0.00000967 for the bottom band. These thresholds act as prompt markers of price support and resistance. SHIB seems to be set to oversell as the market swings towards the bottom band.
With a reading of -0.00000027, the Moving Average Convergence Divergence (MACD), which is below the signal line, is in the negative region. There is an increase in selling pressure because the blue MACD line is below the signal line and the bears are tightening their grip on the price of SHIB.
At a score of 16.89, the Relative Strength Index (RSI) is oversold. Given that the selling pressure is getting stronger, this RSI position suggests that the market may keep moving in this direction.

The readings for the Elder Force Index (EFI) and the Bull Bear Power (BBP) are -65.641k and -0.00000092, respectively. The aforementioned indicators’ readings below 0 depict an intensifying selling trend and negative momentum.
The stoch RSI displays a value of 26.15 and a southward-pointing line. However, this only acts as a warning to traders that the market is approaching the extremes of the current trend rather than necessarily indicating that prices will increase.
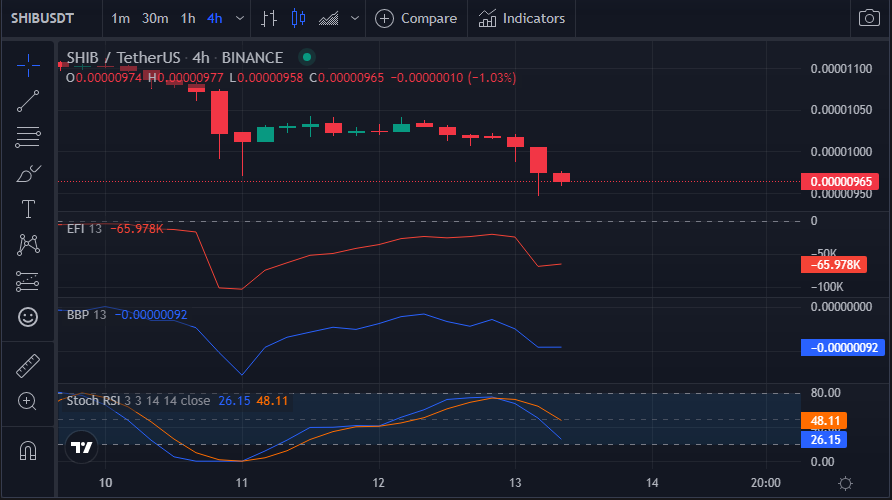
The 5-day Moving Average crosses below the 20-day Moving Average, signaling a bearish crossover on the 4-hour price chart. The 20-day moving average and the 5-day moving average touch at 0.00001030 and 0.00000994, respectively. A downhill movement is confirmed by this crossover. Furthermore, both Moving Averages are higher than the market, which is a bearish sign.

Overall, the market has been taken over by the bears, and if the bulls fail to maintain the resistance level and drive prices higher, this trend may continue.
Disclaimer: The views and opinions, as well as all the information shared in this price analysis, are published in good faith. Readers must do their own research and due diligence. Any action taken by the reader is strictly at their own risk, Coin Edition and its affiliates will not be held liable for any direct or indirect damage or loss.
Disclaimer: The information presented in this article is for informational and educational purposes only. The article does not constitute financial advice or advice of any kind. Coin Edition is not responsible for any losses incurred as a result of the utilization of content, products, or services mentioned. Readers are advised to exercise caution before taking any action related to the company.

 Price Prediction: UNI Eyes $5 as UNI Extends Bullish Breakout")


