


- SHIB attracts significant new addresses despite the market correction, signaling sustained interest.
- Santiment data reveals strong bullish sentiment around SHIB’s growth potential.
- Technical indicators show SHIB’s short-term price remains bullish despite potential overbought conditions.
March kicked off with a bang for Shiba Inu (SHIB) as the meme coin attracted over 8.4k new addresses daily, reaching a peak of 21k new daily addresses. As highlighted by IntoTheBlock, this surge, nearly 20 times February’s daily average, reflects a notable uptick in interest despite the recent market correction. Traders, particularly bullish on SHIB, anticipate a recovery for the token amidst the broader crypto market turbulence.
The recent market reset, catalyzed by Bitcoin’s surge to an all-time high above $69,000 on March 5, led to a significant downturn across various cryptocurrencies. However, social data from Santiment suggests that traders maintain optimism regarding SHIB’s potential for recovery.
Santiment’s analysis indicates a strong bullish sentiment, mainly driven by discussions surrounding SHIB’s recent price and market cap growth. The token surged by an impressive 378% from February 23 to March 6, reflecting the enduring enthusiasm among investors.
Alongside SHIB, dogwifhat (WIF) has captured attention for its remarkable performance in the recent market rally. WIF soared by an astonishing 640% from $0.3068 on February 23 to an all-time high of $2.27 on March 6, leveraging the meme coin mania to achieve substantial gains.
Despite the correction of the price level noticeably after the fall, the investors’ confidence in the prospects of the SHIB is highlighted with a lot of bullish mentions and discussions about buying and holding for investment. Nevertheless, the price tag of SHIB is $0.000031, and its rolling 24-hour trading volume is equal to $4.6 billion, depicting a 13.09% unfavorable change in the last 24 hours.
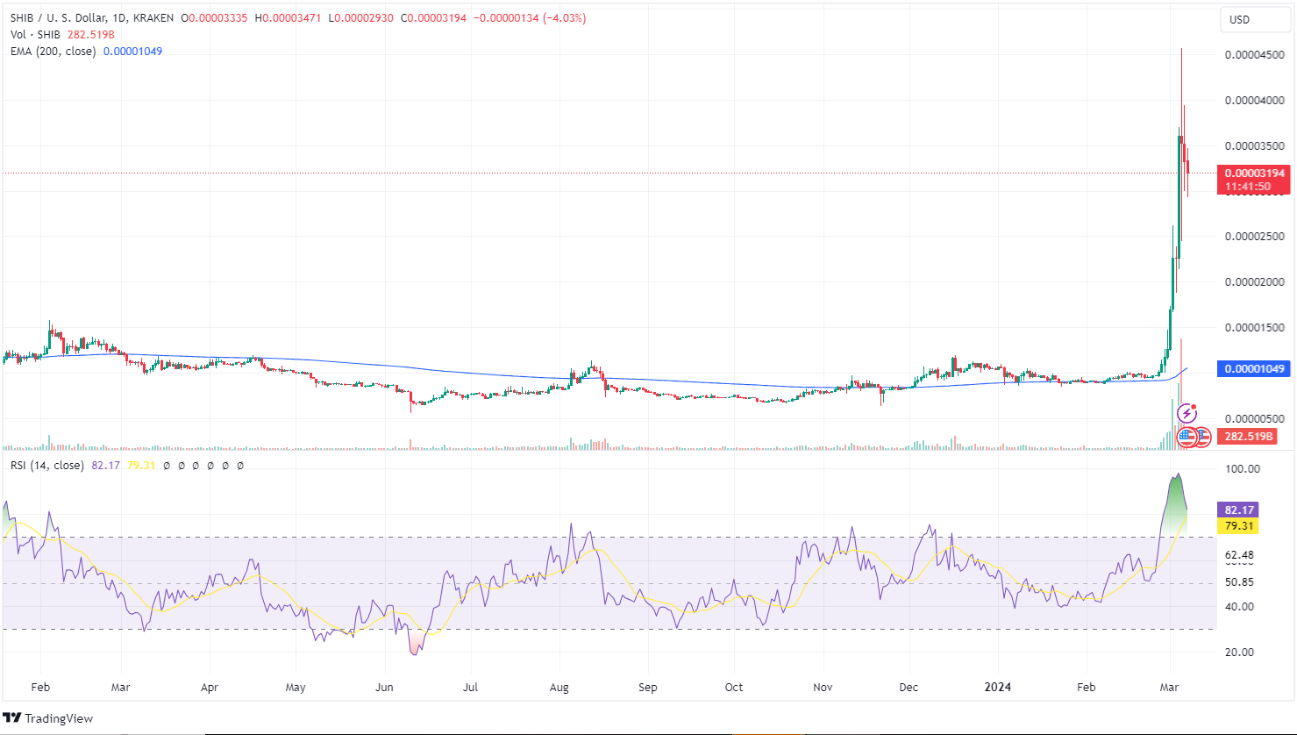
Technical indicators denote that SHIB has entered overbought territory, with the 1-Day RSI reading at 82.83 and it may be due for a retracement. Additionally, the 1-Day MACD hints at weakening buying pressure and a potential trend reversal. However, SHIB’s short-term price remains above the 50 EMA and 100 EMA, indicating bullish momentum.
Disclaimer: The information presented in this article is for informational and educational purposes only. The article does not constitute financial advice or advice of any kind. Coin Edition is not responsible for any losses incurred as a result of the utilization of content, products, or services mentioned. Readers are advised to exercise caution before taking any action related to the company.


