


- SHIB burn rate surges 5564%, fueling market optimism.
- SHIB consolidation hints at a possible bullish breakout.
- The symmetrical triangle pattern signals a potential SHIB breakout.
The meme coin sector recently witnessed Shiba Inu grabbing attention again as its burn rate soared by over 5500%. On May 10, the Shibburn tracker reported that approximately 26 million SHIB had been destroyed in the past 24 hours. This dramatic spike injected a wave of optimism into the dog-themed meme coin’s market prospects.
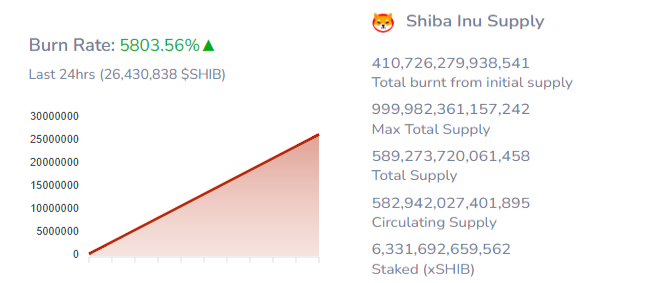
Shiba Inu Burn Rate (Source: Shibburn)
According to Shibburn’s data, Shiba Inu’s burn rate skyrocketed by 5564.09%, removing 25.93 million SHIB from its total supply. The surge offered renewed hope among investors, with the reduced supply anticipated to support a price increase.
SHIB Price Action
As of press time, the Shiba Inu token has experienced a 3.78% climb in the past 24 hours, trading at $0.00002351. This uptick coincides with a recent acceleration in its burn rate, while weekly data suggests consolidation, with SHIB drifting laterally yet garnering a mild 2.48% uptick.
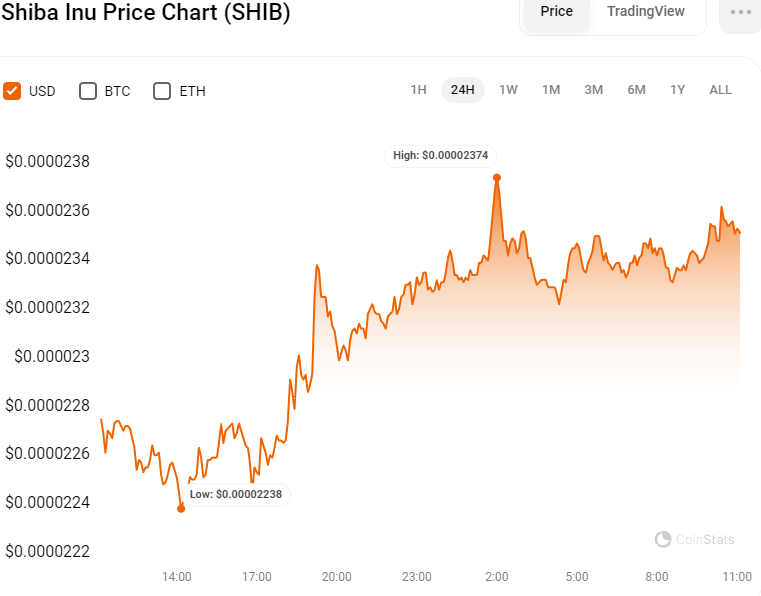
SHIB/USD 24-Hour Chart (Source: CoinStats)
Despite this consolidation, the accelerated burn rate serves as a positive harbinger, hinting at a bullish trajectory for Shiba Inu. Relative to Bitcoin, SHIB has appreciated by 0.69% over the last 24 hours.
This optimistic sentiment has propelled SHIB’s market capitalization, securing its place as the 11th largest cryptocurrency with a 3.29% surge, now standing at $13,840,081,439. On the same accord, its trading volume has ticked up modestly by 1.37%, reaching $382,472,354, reflecting rising investor enthusiasm and assurance.
SHIB Holds Steady in Symmetrical Triangle Pattern
Shiba Inu’s latest bullish ascent is underscored by a symmetrical triangle pattern on the token’s one-day chart, signaling a consolidation phase that portends an impending breakout in either direction. Market participants remain wary as the immediate path is uncertain, hinging on which faction seizes control. A powerful surge looms on the horizon, ready to favor the prevailing force and reshape the trading landscape.
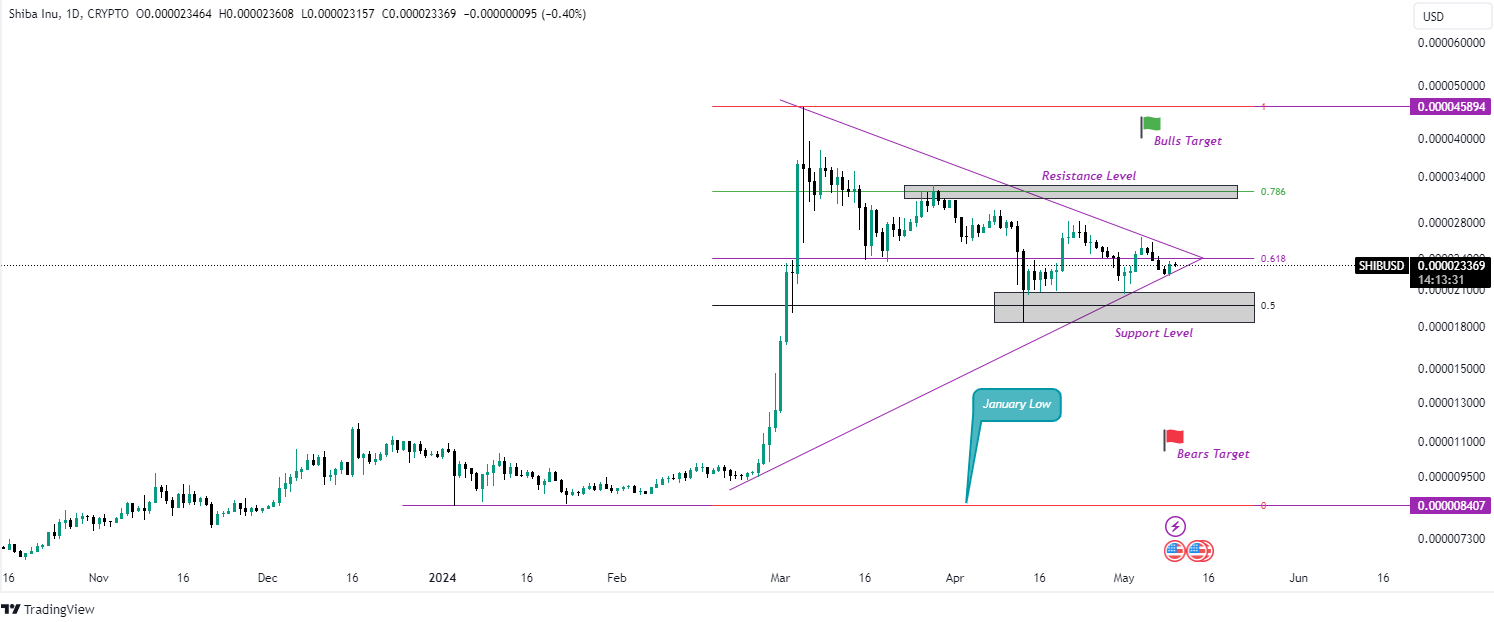
SHIB/USD 1-Day Chart (Source: Tradingview)
If bulls dominate and drive prices upward, a breakout above the symmetrical triangle would signal bullish momentum. This could push the SHIB token to rally towards the resistance level at the 78.6% Fibonacci level, allowing bulls to aim for their target region.
Conversely, if bears seize control, a breakout to the downside would show bearish momentum, potentially leading to a retest of crucial support levels near $0.000020804. A further decline could push the SHIB token towards the January low, where it might find a stronger support level.
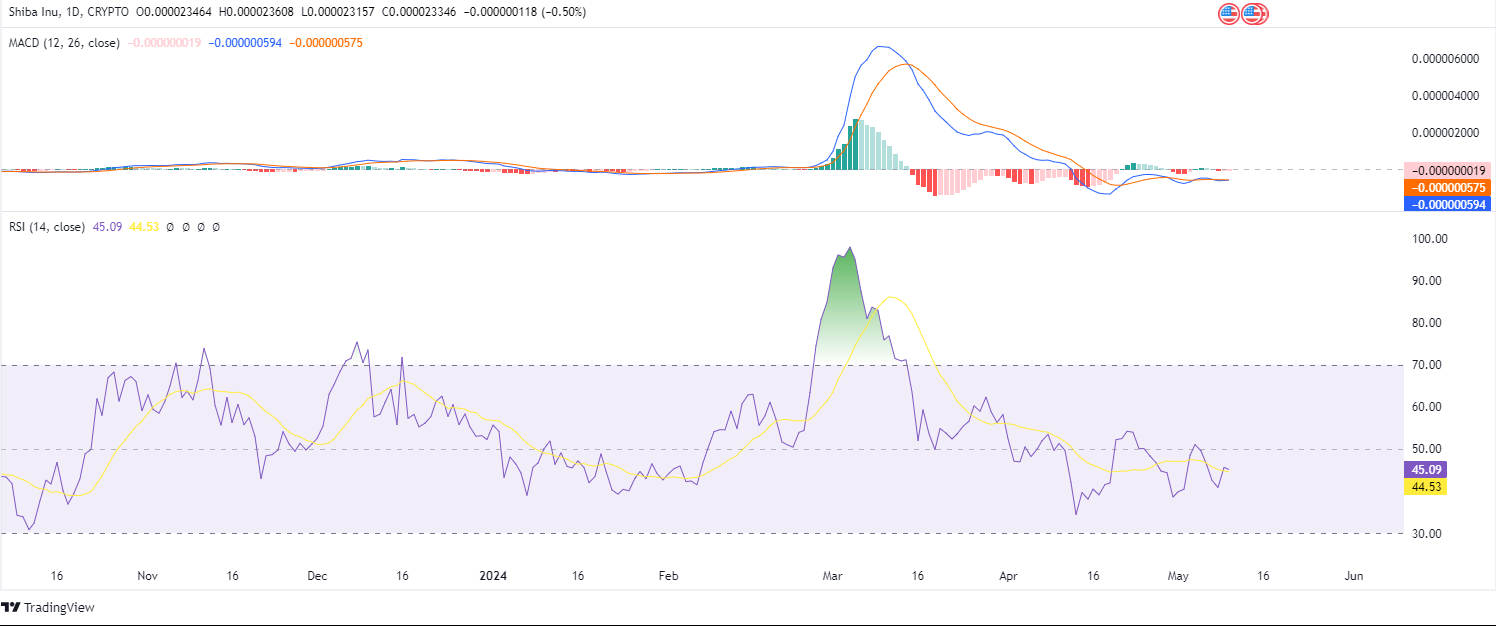
SHIB/USD 1-Day Chart (Source: Tradingview)
Technically, the MACD (Moving Average Convergence Divergence) indicator is flattening around $0.000000595 below the zero line, suggesting consolidation and a potential breakout in either direction. The MACD histogram mirrors this scenario, as its bars are flattening along the zero line, emphasizing the market’s current indecision.
Meanwhile, the RSI (Relative Strength Index) indicator is slightly above the signal line and approaching the neutral zone at 45.09, signifying that SHIB could pivot in any direction. This critical position suggests that traders should closely monitor price movement, as an upward or downward trend could soon emerge.
Disclaimer: The information presented in this article is for informational and educational purposes only. The article does not constitute financial advice or advice of any kind. Coin Edition is not responsible for any losses incurred as a result of the utilization of content, products, or services mentioned. Readers are advised to exercise caution before taking any action related to the company.


