
- SHIB maintains bullish structure as higher lows hold above key EMA support zone
- Resistance near $0.00000660 caps upside as traders take profits on rallies momentum
- Derivatives cooling and balanced flows signal cautious sentiment despite burn activity
Shiba Inu continued to trade in a bullish short-term structure despite slowing momentum near a critical resistance area. The meme-inspired token recently climbed toward the $0.00000670 region before facing renewed selling pressure. Still, buyers continue defending higher lows on the 4-hour chart, keeping the broader recovery structure intact.
Bulls Defend Key Support While Resistance Caps Momentum
SHIB currently trades above its major exponential moving averages, which supports the ongoing bullish setup. The 20 EMA near $0.00000648 continues acting as immediate support during short-term pullbacks. Additionally, the 100 EMA around $0.00000634 and the 200 EMA near $0.00000624 strengthen the broader support structure.
The Supertrend indicator also remains positive, confirming buyers still maintain control of the prevailing short-term direction. However, repeated rejection near the $0.00000660 area signals weakening buying momentum. Traders appear to be locking in profits whenever price approaches that resistance cluster.
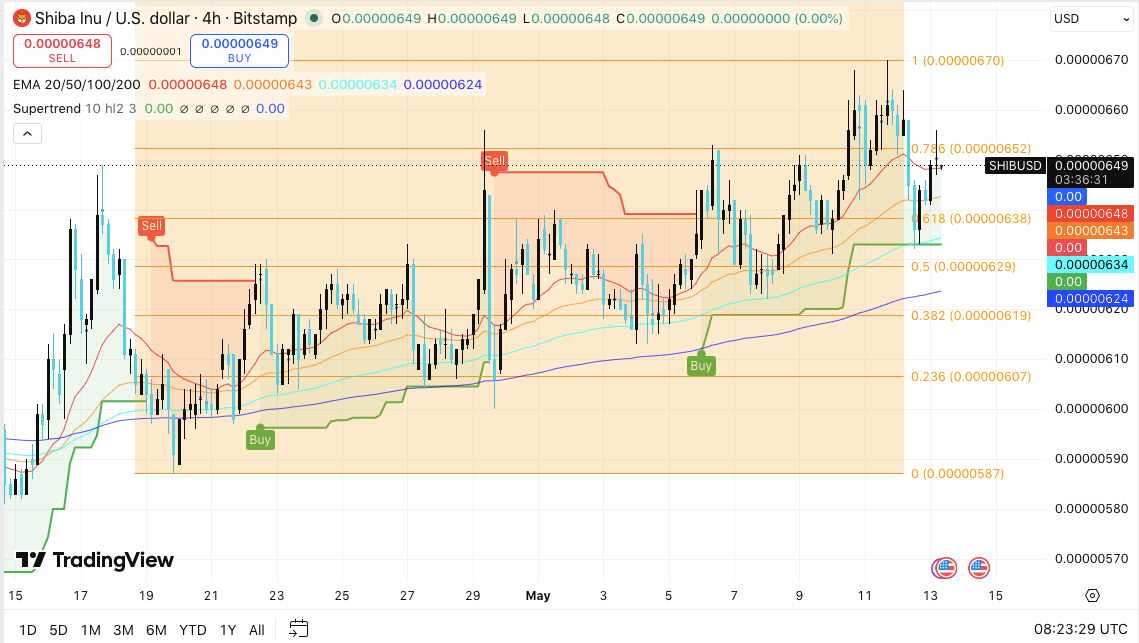
The immediate upside barrier sits near $0.00000652, which aligns with the 0.786 Fibonacci retracement level. A successful breakout above $0.00000670 could open the door toward $0.00000690. Consequently, psychological resistance at $0.00000700 may become the next major target.
Related: XRP Price Prediction: Korean Traders Put XRP Above Bitcoin in Volume as Price Presses $1.50
On the downside, SHIB must hold above the $0.00000638 support level to preserve its bullish structure. Below that zone, stronger support appears between $0.00000629 and $0.00000634. A breakdown under $0.00000619 could trigger extended consolidation and weaken market sentiment further.
Open Interest and Flow Data Reflect Cautious Sentiment
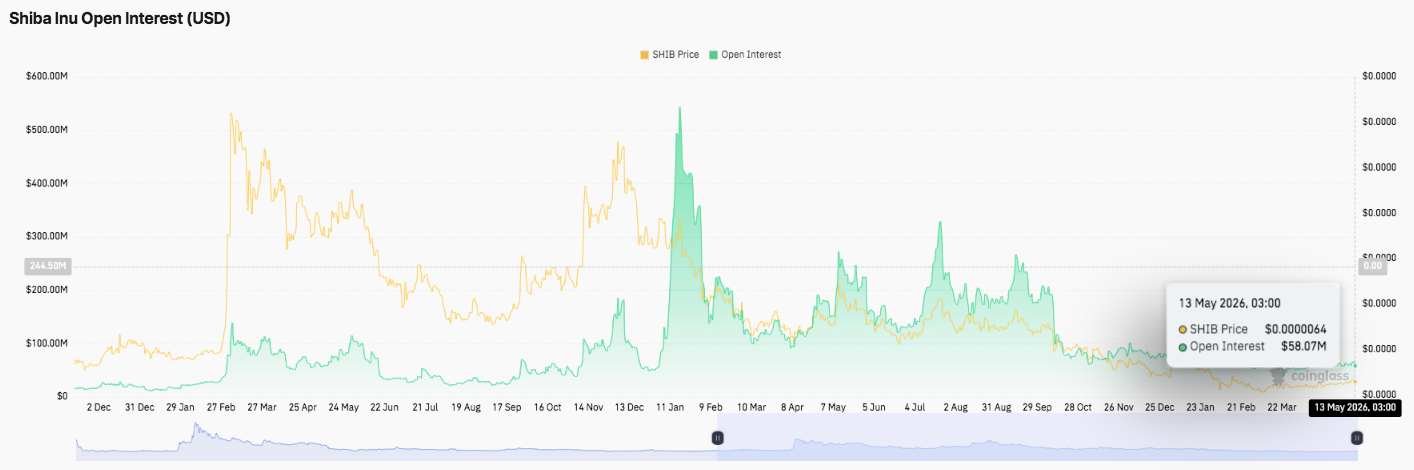
Derivatives data shows speculative activity has cooled significantly compared to previous rally periods. Open interest previously surged beyond $500 million during aggressive bullish phases. However, current open interest sits near $58 million, highlighting reduced leverage exposure and lower trader confidence.
Moreover, recent recovery attempts failed to attract sustained derivatives participation. This trend suggests traders remain cautious despite SHIB’s improving technical structure.
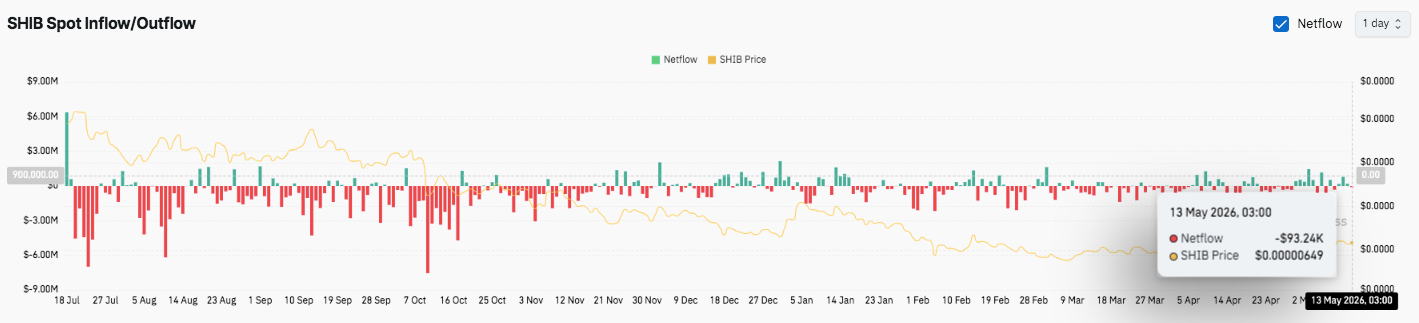
Spot inflow and outflow metrics also reflect unstable sentiment across the market. Exchange outflows dominated several months, indicating persistent selling pressure and fading momentum. However, recent data shows inflows and outflows becoming more balanced, which may indicate early stabilization.
Burn Activity Continues Supporting Long-Term Deflation
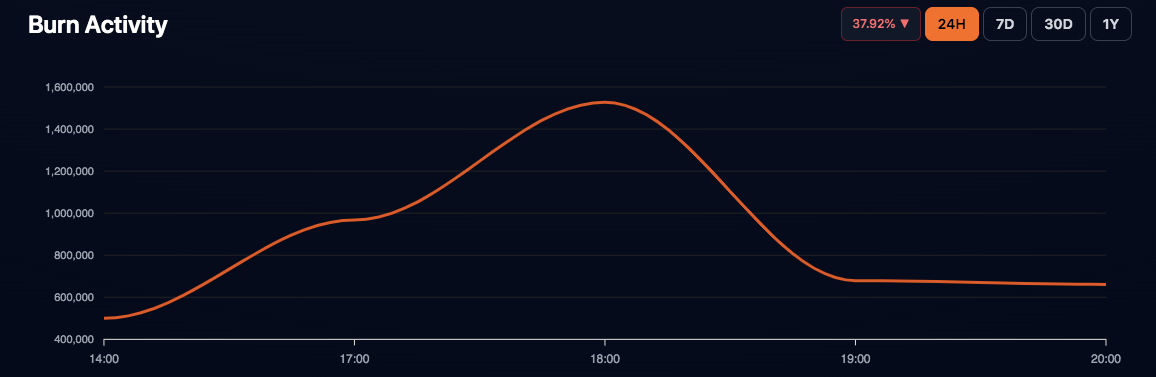
Shiba Inu’s ecosystem continues recording notable token burns despite slower market activity. The network has now burned more than 410.8 trillion SHIB tokens, valued near $7.36 billion. Meanwhile, circulating supply remains above 585.5 trillion tokens.
Related: Cardano Price Prediction: ADA Faces Selling Pressure After Rejection at $0.288 Zone
Recent burn activity remains modest but consistent. Over the past 24 hours, more than 4.3 million SHIB tokens were removed from circulation. Additionally, nearly 190 million tokens were burned during the last 30 days, reinforcing the project’s long-term deflationary strategy.
Technical Outlook for Shiba Inu Price
Shiba Inu (SHIB) trades in a tightening structure as May price action reflects compression after repeated rejections near local highs.
Upside levels: $0.00001238, $0.00001264, and $0.00001286 act as immediate resistance hurdles. A clean breakout above this cluster could shift momentum strongly. Additionally, $0.00001472 and $0.00001600 remain extended upside targets if bullish flow strengthens.
Downside levels: $0.00001180 trendline support remains the key structural level. Below that, $0.00001100 and $0.00000999 form deeper downside zones if selling pressure increases.
Resistance ceiling: $0.00001364 (200-day EMA) remains the major level that must flip to confirm medium-term bullish control.
SHIB continues to compress inside a descending wedge, which often precedes sharp directional moves. Besides, volatility has contracted significantly during May, suggesting an expansion phase may develop soon.
However, price still respects both support and resistance boundaries. Hence, the market remains neutral until a confirmed breakout occurs. Additionally, volume inflows will play a decisive role in confirming direction.
Will Shiba Inu Go Up?
Shiba Inu’s May outlook depends on whether buyers defend $0.00001180 long enough to challenge the $0.00001264–$0.00001286 resistance cluster. If support holds, SHIB may attempt another recovery phase toward higher resistance levels.
If bullish momentum strengthens alongside rising inflows, price could extend toward $0.00001472 and possibly $0.00001600. However, failure to hold $0.00001180 would weaken the structure and expose SHIB to $0.00001100 and lower levels.
Related: Ethereum Price Prediction: JPMorgan Builds On Ethereum While BlackRock Pulls $102M Out In One Day
Overall, SHIB remains in a critical compression phase in May. Consequently, the next breakout direction will define its medium-term trend.
Disclaimer: The information presented in this article is for informational and educational purposes only. The article does not constitute financial advice or advice of any kind. Coin Edition is not responsible for any losses incurred as a result of the utilization of content, products, or services mentioned. Readers are advised to exercise caution before taking any action related to the company.
")


