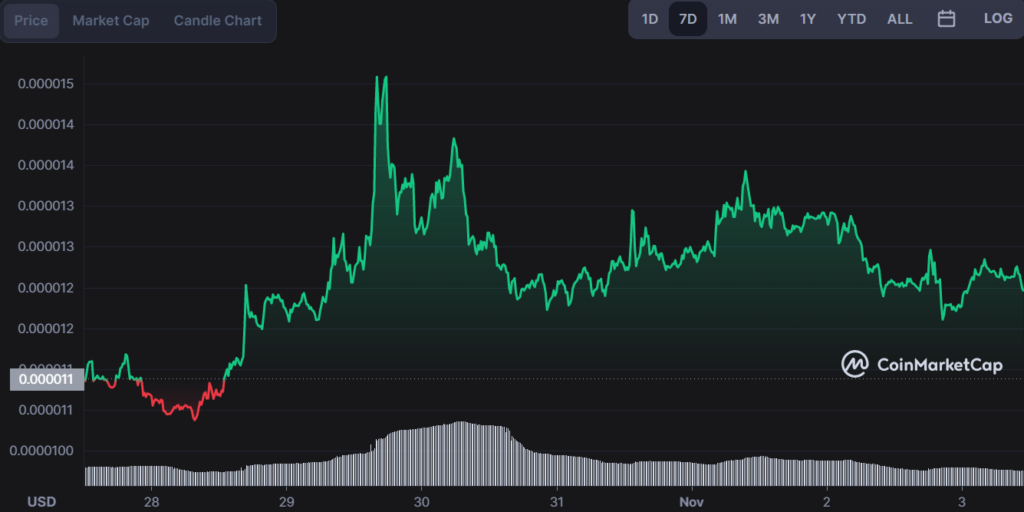
- Shiba Inu has been trading in a range of $0.00001159 to $0.00001248.
- SHIB is currently retesting its support at $0.00001201 after briefly breaking above $0.00001300.
- The altcoin has seen significant volatility in the past week, with a weekly high of $0.00001566 and a weekly low of $0.00001149.
The Shiba Inu cryptocurrency, also known as SHIB, has experienced a period of volatility in the past week. On October 29, the coin reached a weekly high of $0.00001458 but has since dropped to a low of $0.00001198. SHIB is down by 0.34% while the altcoin is up by 8.4% on the weekly chart.

Currently, SHIB is trading at $0.00001196, slightly above its support level of $0.00001159. This retracement follows a period of positive gains, with SHIB closing last week at $0.00001263. It remains to be seen if SHIB will continue to experience volatility or if it will settle into a stable trading range in the coming days.
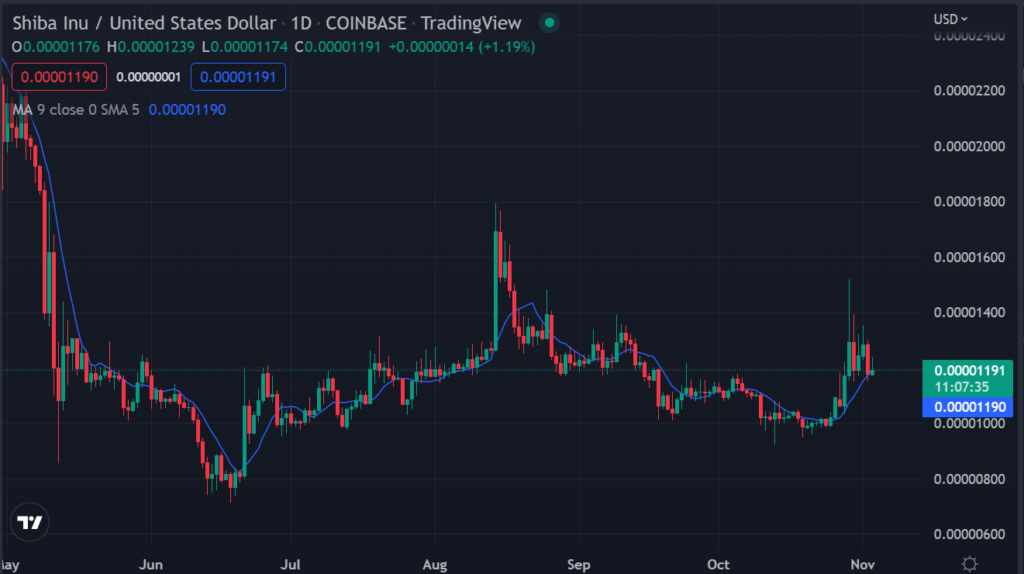
The Fibonacci retracement tool shows potential support levels at $0.00001181 and $0.00001102, with resistance at $0.00001248 and $0.00001327. The long-term outlook for SHIB is however bullish as the SHIB’s price is above the 200-day moving average of $0.00000988.

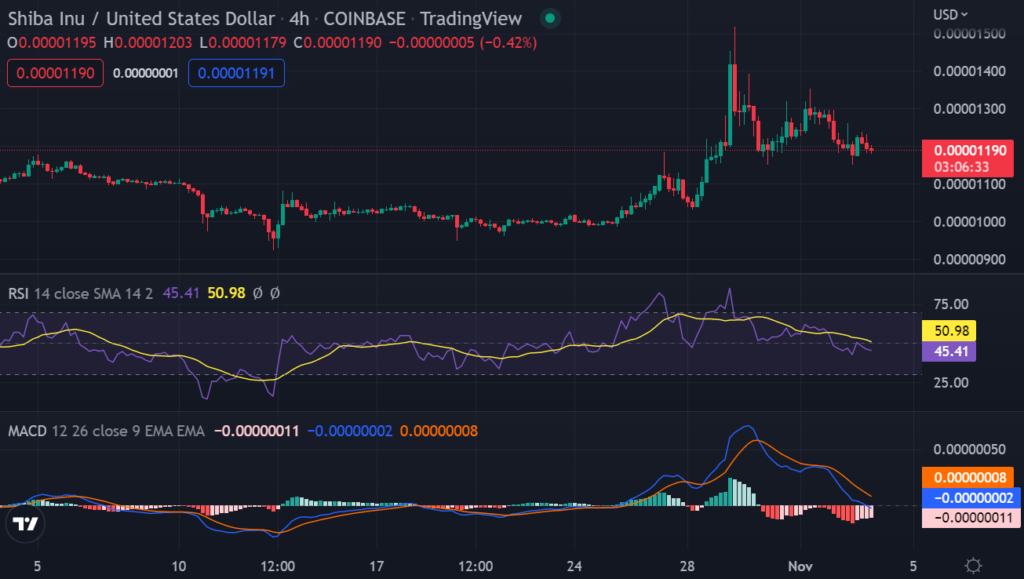
Looking at the technical indicators, the MACD is showing bearish momentum while the RSI is at 40.9, indicating that SHIB is currently in the neutral zone. The daily chart shows bull dominance, with the 50-day moving average above the 200-day moving average.
A bearish pattern has formed on the 4-hour chart, with the 50-MA crossing below the 200-MA. A bullish green candlestick is however present, indicating that SHIB may see some upward momentum in the short term.

Further technical indications show SHIB’s market is in consolidation, with a potential breakout to the upside in the next few days. The bears seem to be adamant about pushing the price down while bulls are attempting to defend support levels. The current level is a critical juncture for SHIB and traders should monitor price action closely.
Overall, traders may want to keep a close eye on SHIB’s support and resistance levels in the short-term, while also considering the long-term bullish outlook for the altcoin. Additionally, monitoring technical indicators can provide insight into potential price movements.
Disclaimer: The views and opinions as well as all the information shared in this price analysis, are published in good faith. Readers must do their own research and due diligence. Any action taken by the reader is strictly at their own risk. Coin Edition and its affiliates will not be held liable for any direct or indirect damage or loss.
Disclaimer: The information presented in this article is for informational and educational purposes only. The article does not constitute financial advice or advice of any kind. Coin Edition is not responsible for any losses incurred as a result of the utilization of content, products, or services mentioned. Readers are advised to exercise caution before taking any action related to the company.


