 Devalues Up to $0.000008263 After Facing Loss")
- Shiba Inu price analysis today shows a negative market sentiment
- SHIB prices are facing strong rejection at the $0.000008728 level
- The immediate support is found at $0.000008226
Shiba Inu (SHIB) price analysis for today shows SHIB is currently stuck in a consolidation phase around the $0.000008263 mark. This comes after the currency saw a sharp drop in value this week, as sellers pushed the price below key support levels.
The main resistance level for SHIB is at $0.000008728, and it appears that this level will act as a major hurdle for the currency going forward. The immediate support level is at $0.000008226, although traders should expect further downside pressure in the near term.
SHIB price analysis on a daily chart shows that the bulls are having a hard time regaining control of the market. The digital asset has lost nearly 4.23% of its value in the last 24 hours, and it remains to be seen if the bulls can turn things around. The Market for SHIB/USD opened at $0.000008486 today, and buyers pushed the price up to a high of $0.000008263 before losing momentum as the sellers took control.
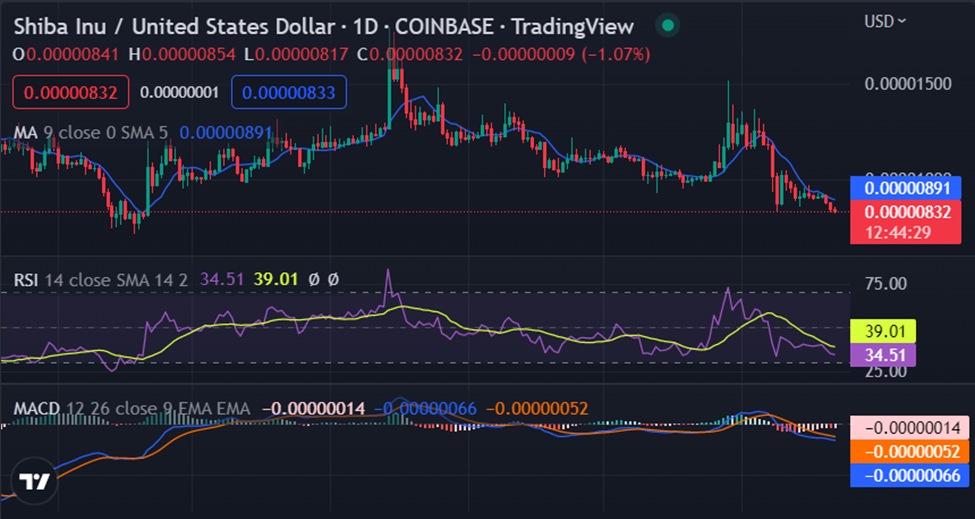
The technical indicators are still bearish with the RSI currently trading at the 39.01 level, which shows that there is still some room for prices to fall further before reaching oversold territory. The MACD, on the other hand, is giving a bearish signal as the histogram is falling and is about to cross below the zero line. The MACD line is clearly below the red signal line and seems to be gaining strength. The 200 SMA line is well placed below the current market price, which is a sign that the path of least resistance is still to the downside.
SHIB price analysis on the 4-hour chart shows that the coin is currently in bearish market sentiment. The market decline shifted to the bearish sentiment as indicated by the RSI line which is headed below the 50.00 level. The RSI indicator is currently trading at 34.08 and heading toward the oversold territory which is another sign that prices are likely to fall further in the short term.
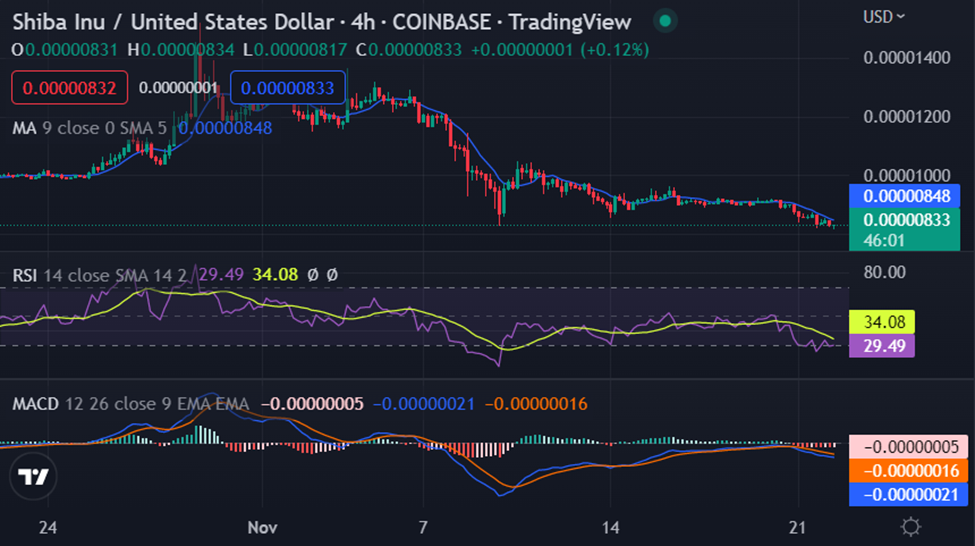
SHIB price was stuck in a critical juncture of sideways trading before the bears won the battle and prices succumbed to selling pressure. The MACD indicator is also signaling a further decline as the histogram is falling and about to cross below the zero line. The moving average lines are also in favor of the bears as the 100 SMA is below the 200 SMA in a bearish alignment.
In conclusion, SHIB price analysis suggests that a downward movement in price has been recorded following a recent loss. However, if the currency can hold steady above key support levels, then there may be hope for a price recovery in the near future.
Disclaimer: The views and opinions, as well as all the information shared in this price analysis, are published in good faith. Readers must do their own research and due diligence. Any action taken by the reader is strictly at their own risk. Coin Edition and its affiliates will not be held liable for any direct or indirect damage or loss.
Disclaimer: The information presented in this article is for informational and educational purposes only. The article does not constitute financial advice or advice of any kind. Coin Edition is not responsible for any losses incurred as a result of the utilization of content, products, or services mentioned. Readers are advised to exercise caution before taking any action related to the company.


 Price Prediction: UNI Eyes $5 as UNI Extends Bullish Breakout")

