


 Investors Expect Another 50% Hike?")
- FET outperformed BTC in the last 24 hours, showing signs of a renewed rally.
- After breaking out of the supply zone, FET is eyeing a jump to $0.40.
- With increasing trends around the AO, MACD, and RSI, sellers may find it difficult to invalidate the bullish outlook.
Fetch.ai (FET) posted a 13.50% gain in the last 24 hours, cementing the AI token’s position as the cryptocurrency with one of the best performances in all of October. The move follows a month filled with hikes for Bitcoin (BTC) as the number one coin in terms of market cap tries to blast above the $35,000 psychological level.
FET’s rally is not only dependent on Bitcoin’s movement. In fact, its latest increase could be linked to a series of positive developments that could happen in the Artificial Intelligence (AI) space over the next few weeks.
Fetch.ai itself also announced the release of DeltaV, an open platform for the new AI economy earlier in the month. The development has impacted growth in Fetch.ai’s network with the token experiencing an increase in adoption.
Out of the Obstacles
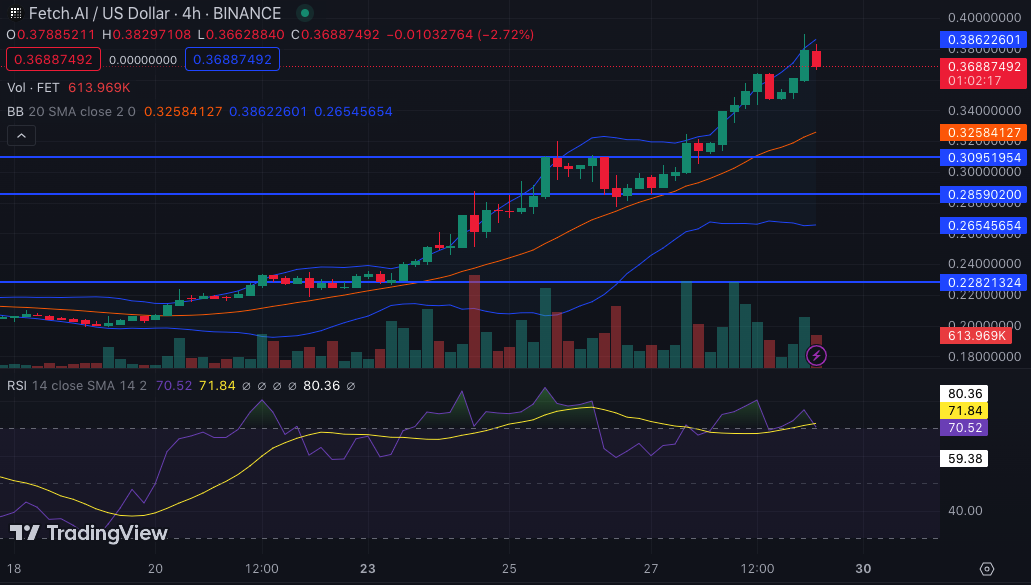
FET broke out of the supply zone after support was established at $0.22. The support quickly turned into an upside run for the AI token. However, the price was rejected at $0.30. But it did not take long before bulls pushed the resistance back.
Currently, bears are nowhere near market control, and as long as support holds at $0.28, FET still has a good potential for its value to increase. Furthermore, the Relative Strength Index (RSI) tilted north, hitting as high as 70.52.
Hence, momentum may continue to rise for FET. Although the RSI reading is considered overbought, it is unlikely for the token to plunge considering the macroeconomic catalyst and buying pressure currently present.
FET Eyes $0.40
In a very bullish circumstance, FET may jump beyond $0.40. But this would require increased buying pressure. With increasing volatility shown by the Bollinger Bands (BB), FET could be ready for a significant upswing.
Two other indicators supporting an upswing are the Awesome Oscillator (AO) and Moving Average Convergence Divergence (MACD). At the time of writing, the AO was 0.057. The presence of green bars on the positive side of the indicator is a reflection of the bullish control.
Should the AO continue its stay in the positive territory, then FET’s potential hike to $0.40 could only be the beginning of another jump above the level. The MACD also tells a similar tale. This was because the 12-period EMA (blue) was above the 26-period EMA (orange).
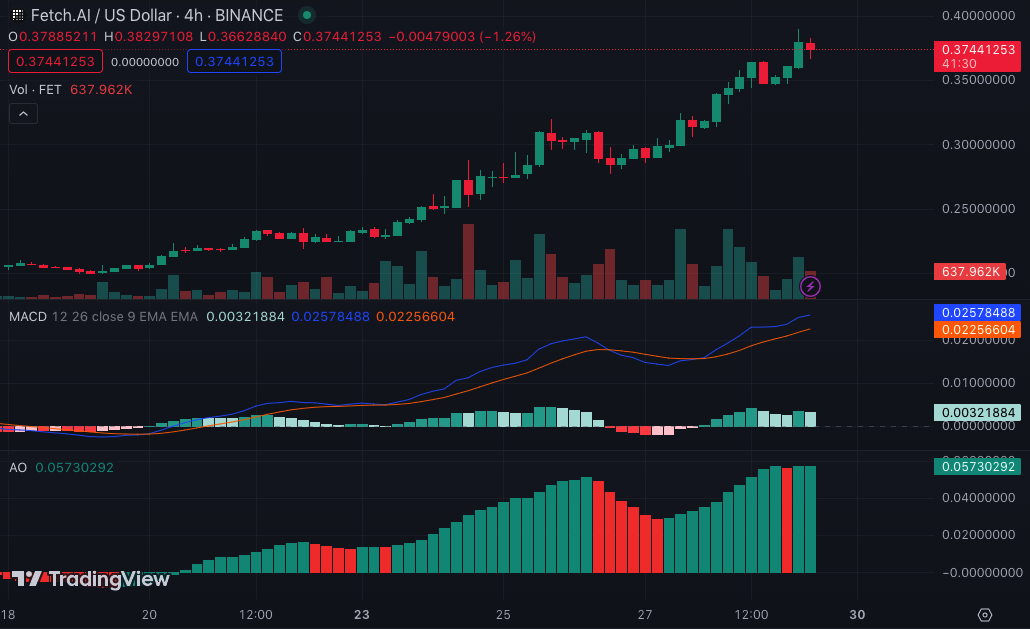
The position held by these indicators means that buy order blocks were much more than the sell side. Thus, holders of FET may be looking at another 20% to 30% gain provided sellers stay out of the way.
Disclaimer: The information presented in this article is for informational and educational purposes only. The article does not constitute financial advice or advice of any kind. Coin Edition is not responsible for any losses incurred as a result of the utilization of content, products, or services mentioned. Readers are advised to exercise caution before taking any action related to the company.
: What Happens If You Use an Unlicensed Platform?")


