


- Santiment revealed that SOL was quick to recover to above $71 following the latest market crash.
- In an X post, the analytics platform shared that there is a high level of FOMO surrounding recent and upcoming airdrops on Solana.
- Technical indicators on SOL’s chart suggested that its price may drop to $60 in the next 24-48 hours.
The blockchain analytics platform Santiment revealed in an X post earlier today that the altcoin market recovered quickly after the latest market-wide selloff. Solana (SOL) stood out from the pack and was able to rise back above the $71 mark. According to the post, SOL is gaining quickly compared to the majority of altcoins.
Despite SOL’s current strength, Santiment suggested that the positive sentiment surrounding the project needs to cool down a bit before the altcoin can experience “a serious run”. In another post, the platform speculated that there may be a degree of FOMO surrounding recently hyped airdrops on Solana.
At press time, SOL was one of the handful of cryptocurrencies that managed to record a gain in the past 24 hours. Data from the cryptocurrency market tracking website CoinMarketCap indicated that SOL was up 1.16%. Subsequently, the altcoin was trading hands at $70.34.
This latest increase in price added to SOL’s positive weekly streak as well. As a result, the altcoin’s weekly performance stood at +16.77%.
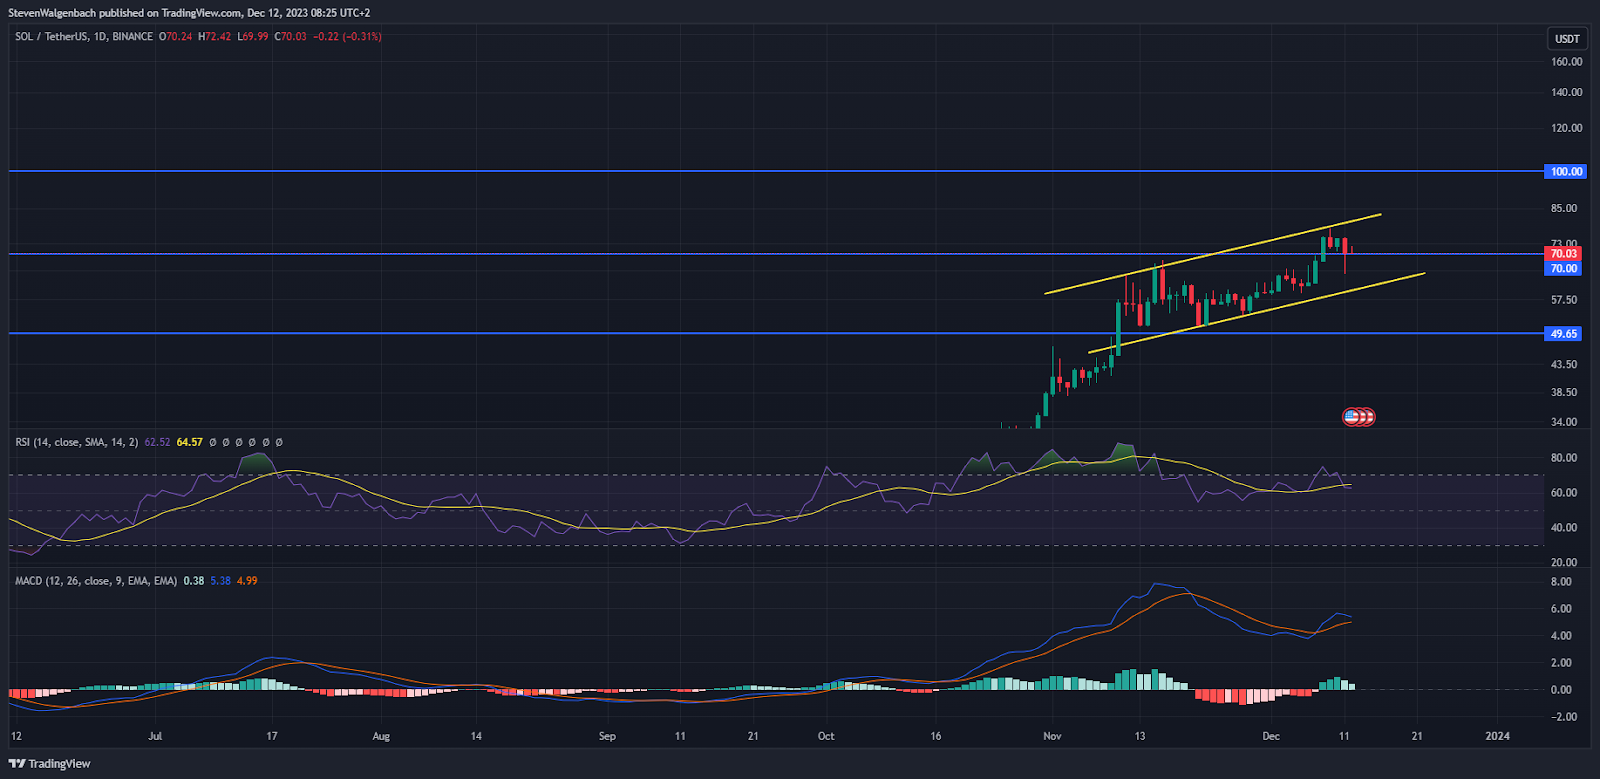
SOL was testing the key support level at $70 at press time. A drop below this level could lead to the altcoin’s value falling to around $60. This is the same price point as the lower level of a medium-term positive price channel that has formed on the altcoin’s daily chart. Should SOL break below this channel, it could be at risk of testing the next key support at $49.65.
This bearish thesis may be invalidated if SOL is able to close the next two daily candles above $70. In this more bullish scenario, the cryptocurrency could enter into a bullish move, potentially leading to SOL rising to $100.
Technical indicators suggested that SOL’s price drop is not over yet. Both the Moving Average Convergence Divergence (MACD) and the Relative Strength Index (RSI) indicators suggested that SOL could drop in the next 48 hours.
The RSI line crossed below the RSI Simple Moving Average (SMA) line over the past 48 hours. This is a significant bearish technical flag which indicates that sellers have gained the upper hand against buyers. In addition to this, the MACD line was breaking down towards the MACD Signal line. These two lines crossing could signal a continuation of the bearish trend.
Disclaimer: The information presented in this article is for informational and educational purposes only. The article does not constitute financial advice or advice of any kind. Coin Edition is not responsible for any losses incurred as a result of the utilization of content, products, or services mentioned. Readers are advised to exercise caution before taking any action related to the company.


 Price Prediction 2026, 2027, 2028, 2029, 2030-2050")
 Price Prediction 2026, 2027, 2028, 2029, 2030-2050")