





- SOL holds above $74 support as traders watch for a breakout above key EMAs.
- Open interest rebounds to $4.97B, signaling confidence gradually returns to SOL.
- Modest exchange inflows support accumulation, but resistance still caps momentum.
Solana continued to trade within a narrow range after its recent rally lost momentum, leaving traders focused on whether the cryptocurrency can regain its upward trajectory. SOL climbed from its $60 swing low to a local high near $84 before entering a consolidation phase.
The token now changes hands around $75, reflecting a market that remains undecided despite improving participation from derivatives traders and steady spot demand. Although buyers still defend critical support levels, several technical barriers continue to limit the pace of any immediate recovery.
SOL Faces Critical Resistance After Rally
SOL currently trades just below its 20-day and 50-day exponential moving averages, positioned at $76.52 and $76.65 respectively. Meanwhile, the price also remains beneath the 100-day EMA at $81.00. The 200-day EMA near $94.97 continues to reinforce the broader bearish market structure despite recent gains.
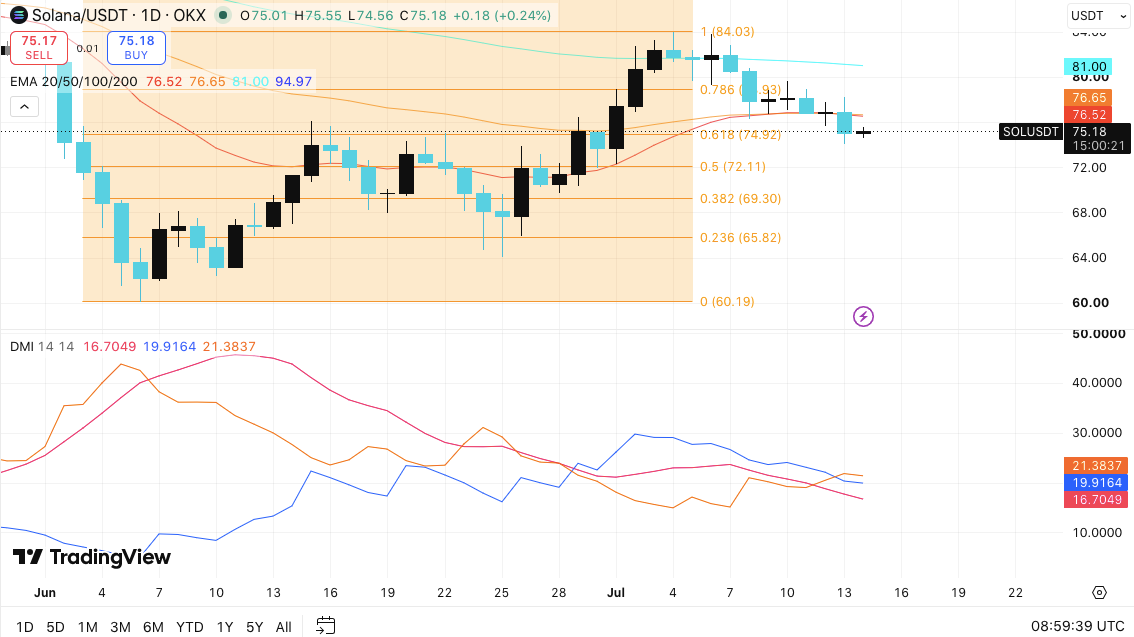
The 0.618 Fibonacci retracement level at $74.92 has emerged as the most important short-term support. Buyers continue defending this area, preventing a deeper correction. However, sustained buying pressure remains necessary before the market can challenge higher resistance levels.
If SOL maintains support above $74.92, the price could retest the EMA cluster near $76.65. A successful move beyond that zone may expose the 100-day EMA at $81.00 before another attempt toward the recent swing high at $84.03.
Conversely, losing the Fibonacci support would likely shift attention toward $72.11. Additional downside could extend to $69.30 and $65.82 if selling pressure accelerates.
Related: XRP Price Prediction: Sentiment Hits 5-Week High FOMO As Descending Wedge Forces A Breakout Decision
Momentum indicators also suggest the market has entered a period of consolidation instead of a strong trend. The Directional Movement Index continues favoring buyers, with the positive directional indicator remaining above the negative indicator. However, the Average Directional Index points to only moderate trend strength, highlighting limited conviction from both bulls and bears.
Derivatives Activity and Exchange Flows Improve
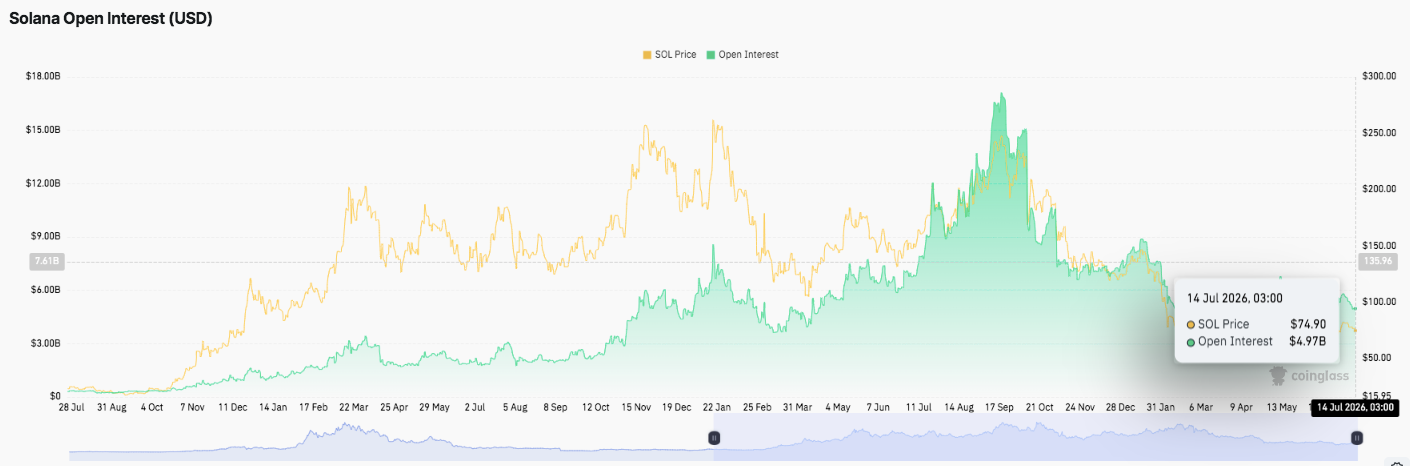
Derivatives data shows traders have gradually returned after months of declining activity. Open interest currently stands near $4.97 billion, recovering from much lower levels reached during the broader market correction.
Earlier peaks above $15 billion reflected significantly stronger speculative demand. Therefore, the latest increase suggests confidence is slowly returning rather than aggressive positioning.
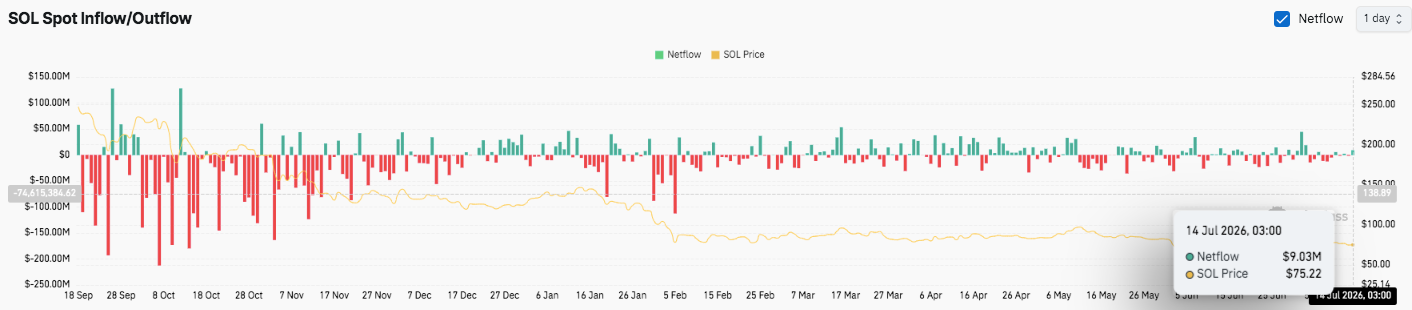
Spot market activity also presents a balanced picture. Exchange inflows and outflows have alternated for several months, preventing either buyers or sellers from gaining complete control.
Related: Cardano Price Prediction: ADA Faces Bearish Pressure as Whales Accumulate 25.6B ADA
The latest net inflow of roughly $9.03 million indicates modest accumulation while SOL trades near $75. Although investor confidence continues improving, stronger and more consistent capital inflows will likely determine whether Solana can extend its recovery toward higher resistance levels in the coming sessions.
Technical Outlook for Solana Price
Key technical levels continue to shape Solana’s short-term outlook as the cryptocurrency consolidates following its recovery from the $60 swing low.
Upside levels: $76.52–$76.65 (20-day and 50-day EMA cluster) remain the first resistance zone, followed by the 100-day EMA at $81.00. A decisive breakout above the recent swing high at $84.03 would strengthen bullish momentum and open the path toward higher recovery targets.
Downside levels: Immediate support sits at the 0.618 Fibonacci retracement of $74.92. A breakdown below this level could send SOL toward $72.11, followed by $69.30 and $65.82. The major long-term support remains the $60.19 swing low.
Resistance ceiling: The 100-day EMA at $81.00 remains the key technical barrier before bulls can challenge the $84.03 high. Meanwhile, the 200-day EMA at $94.97 continues to define the broader bearish trend.
The technical structure suggests Solana is trading within a consolidation range after its recent rally. Moderate trend strength, combined with improving open interest and balanced exchange flows, indicates traders are cautiously rebuilding positions rather than aggressively chasing higher prices.
Will Solana Go Up?
Solana’s near-term direction depends on whether buyers can continue defending the critical $74.92 support while reclaiming the EMA resistance cluster around $76.65. A sustained recovery above $81.00 would improve the technical outlook and increase the likelihood of a retest of $84.03. Continued growth in open interest alongside stronger spot inflows would further support that bullish scenario.
However, failure to hold $74.92 would weaken market sentiment and raise the probability of a deeper pullback toward $72.11 and $69.30. For now, SOL remains at an important technical crossroads, with both price action and capital flows likely to determine the next significant move.
Disclaimer: The information presented in this article is for informational and educational purposes only. The article does not constitute financial advice or advice of any kind. Coin Edition is not responsible for any losses incurred as a result of the utilization of content, products, or services mentioned. Readers are advised to exercise caution before taking any action related to the company.




