
- XRP fell 1.76% to $1.0667 on August 3, trading below all four EMAs as the Bollinger Band squeeze signals a directional move ahead
- Ripple invested in ZILO and Licuido on August 3, bringing regulated transfer agency and collateral mobility to the XRP Ledger
- Cumulative XRP ETF inflows hit $1.5B, the highest among altcoin products, though monthly pace has dropped from $131.94M in May to $27.29M in July
XRP trades at $1.0667 on August 3, down 1.76%, still sliding inside a descending wedge despite a $1.5B ETF inflow milestone and Ripple’s biggest capital markets announcement of the week.
XRP Compresses Inside the Descending Wedge as Bollinger Bands Squeeze
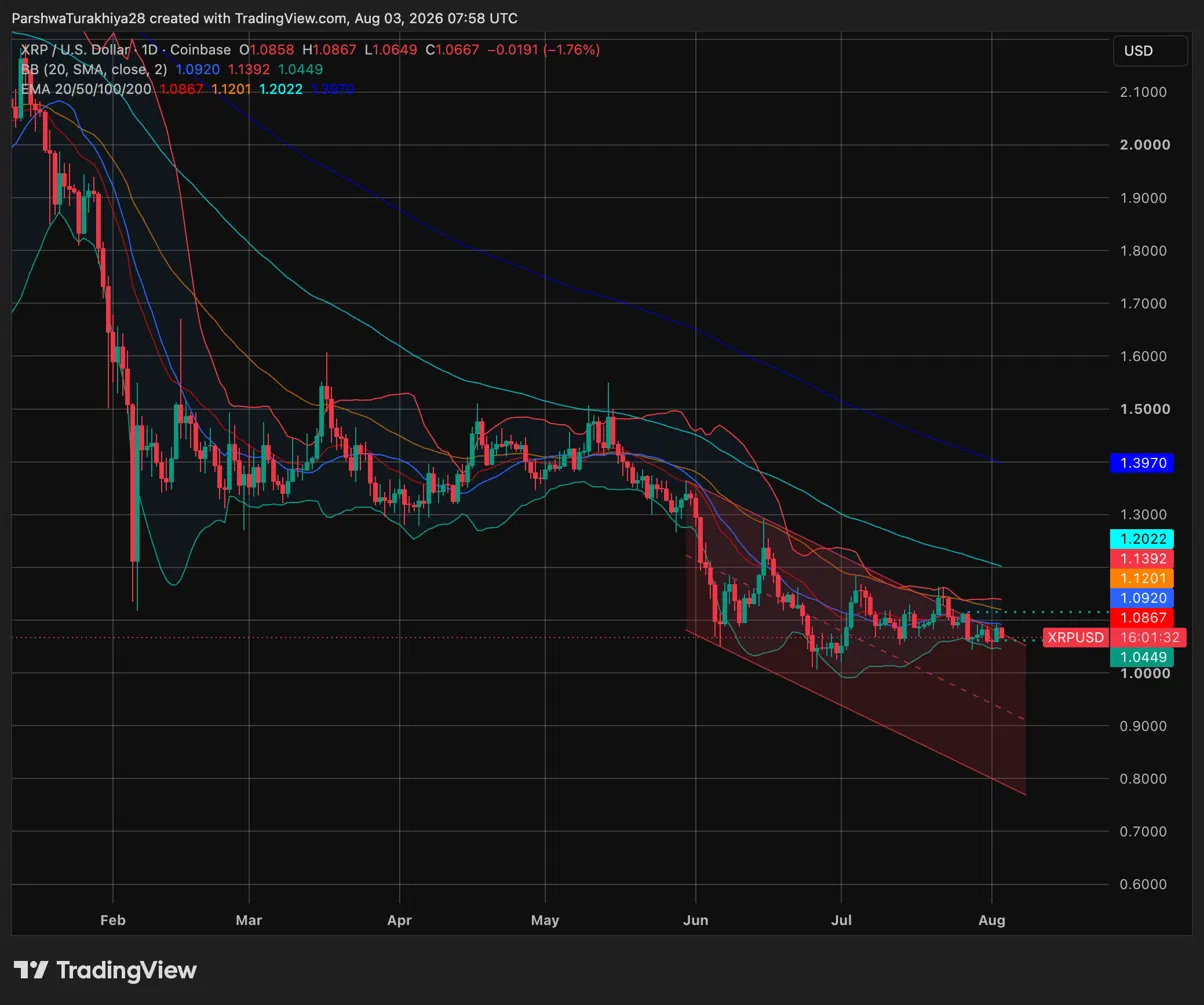
The daily chart shows XRP inside a descending wedge that has been tightening since June, with both trendlines visibly converging. Today’s session opened at $1.0858, briefly tapped $1.0867, and slid to a low of $1.0649 before closing at $1.0667. The Bollinger Band lower boundary at $1.0449 is the immediate floor below, with the midline at $1.0920 capping upside on any intraday recovery.
Related: Ethereum Price Prediction: Can ETH Break $2,000 as ETH/BTC Ratio Forms a Cup and Handle?
All four EMAs slope downward above current price. The 20-day at $1.0867 is the first level to reclaim, followed by the 50-day at $1.1201 and the 100-day at $1.2022. The 200-day at $1.3970 represents the longer term ceiling. The Bollinger Band squeeze signals a directional move is approaching as the wedge narrows, but price remains below every key level until a confirmed break above the upper wedge trendline near $1.10.
XRP Support and Resistance Levels, August 3, 2026
| Type | Price | Level |
| Resistance | $1.0867 | 20-day EMA, immediate ceiling |
| Resistance | $1.0920 | Bollinger Band midline |
| Resistance | $1.1201 | 50-day EMA |
| Resistance | $1.1392 | Bollinger Band upper boundary |
| Resistance | $1.2022 | 100-day EMA |
| Support | $1.0449 | Bollinger Band lower boundary |
| Support | $1.0000 | Round number and psychological floor |
Ripple Invests in ZILO and Licuido to Build Out Capital Markets Infrastructure
Ripple announced strategic investments in two firms on August 3, ZILO and Licuido, both of which plug directly into XRP Ledger infrastructure. The deals build on existing partnerships between the three companies.
ZILO provides digital transfer agency and fund administration technology, giving asset managers and custodians the regulated record-keeping infrastructure needed to run tokenized share classes, lending, and collateral markets. Licuido is an FCA-regulated tokenization and trading platform that manages the issuance, distribution, and execution of digital assets, allowing fund shares and traditional financial instruments to move freely as collateral through on-chain atomic settlement.
Together the two investments fill specific gaps in Ripple’s institutional stack. Tokenized funds can be used as collateral from the point of issuance, trades settle atomically on the XRPL, and RLUSD serves as the regulated cash leg for delivery-versus-payment transactions. Ripple’s existing collaborations with Aviva Investors, Franklin Templeton, and DBS form the institutional demand side of that infrastructure.
XRP ETF Inflows Reach $1.5B But Monthly Pace Is Slowing
Cumulative XRP ETF inflows have reached approximately $1.5B, the largest total among altcoin ETF products. XRP funds ranked first or second in monthly inflows every month since April, with no meaningful outflows over that stretch.
Related: Bitcoin Price Prediction: Coldcard Hack and ETF Outflows Push BTC Below $63K
The pace has cooled noticeably through the summer though. Monthly inflows ran $81.59M in April, peaked at $131.94M in May, then dropped to $59.46M in June and $27.29M in July. The streak is intact but the buying pressure behind it has faded, which helps explain why cumulative inflows at $1.5B have not translated into price recovery while XRP continues sliding inside the wedge.
Derivatives: Longs Taking More Pain as Open Interest Slides
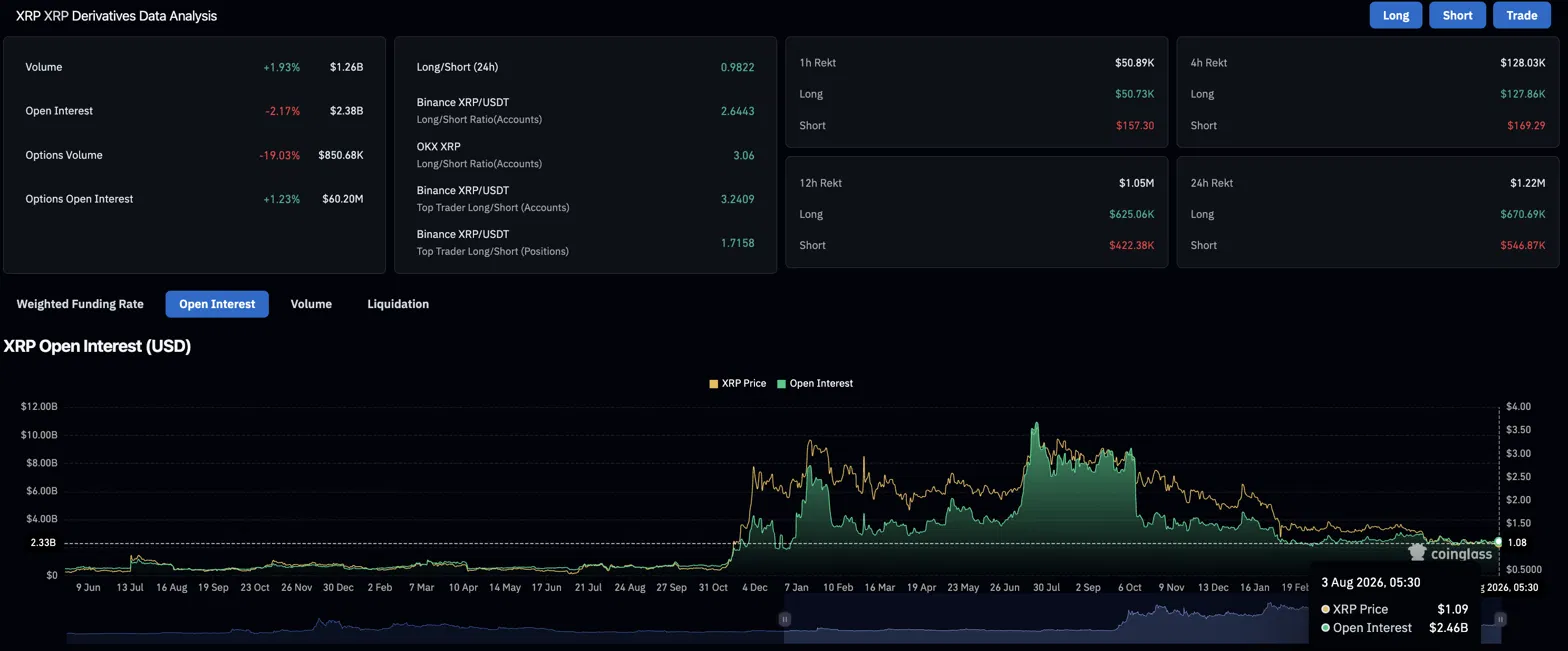
Volume edged up 1.93% to $1.26B while open interest fell 2.17% to $2.38B. Rising volume alongside falling open interest typically means existing positions are being closed rather than new ones being built, pointing to a market where traders are reducing exposure rather than committing fresh capital in either direction.
Account-level ratios tell a consistently long story across exchanges: Binance retail sits at 2.6443, OKX at 3.06, and Binance’s top trader accounts at 3.2409. The overall 24-hour ratio looks balanced at 0.9822, but that is because larger position sizes pull the number toward neutral. Liquidations over 24 hours totaled $1.22M, with longs taking the bigger hit at $670.69K versus $546.87K for shorts, meaning the traders betting on a recovery are currently absorbing more pain than those positioned against it.
| Metric | Value | Interpretation |
| 24h Volume | $1.26B (+1.93%) | Modest activity, no strong directional push |
| Open Interest | $2.38B (-2.17%) | Positions being closed, not added |
| Long/Short Ratio (24h) | 0.9822 | Broadly balanced overall |
| Binance Top Trader L/S (Accounts) | 3.2409 | Large accounts heavily net long |
| Binance Top Trader L/S (Positions) | 1.7158 | Position sizing also net long |
| 24h Liquidations | $1.22M | Longs absorbed the majority |
XRP Price Prediction: Upside and Downside Targets
Bullish Case, Target: $1.1201 (50-day EMA)
The descending wedge breaks to the upside as the Bollinger Band squeeze resolves higher. XRP reclaims the 20-day EMA at $1.0867 on a daily close, with the Ripple capital markets announcement drawing fresh institutional attention and slowing the ETF outflow pace. Top trader long positioning across Binance and OKX gets rewarded as price pushes toward the 50-day EMA at $1.1201.
Bearish Case, Risk Level: $1.0000 (Round Number Floor)
The wedge continues to compress price lower and the Bollinger Band lower boundary at $1.0449 fails to hold. ETF inflow pace continues to slow with no fresh catalyst to attract new buyers, and longs accumulating against the trend absorb further losses. Price tests the $1.00 round number, the last significant psychological floor before uncharted territory below the June lows.
Related: Cardano Price Prediction: Is ADA’s Breakout Still Alive as Governance Activity Ramps Up?
Disclaimer: The information presented in this article is for informational and educational purposes only. The article does not constitute financial advice or advice of any kind. Coin Edition is not responsible for any losses incurred as a result of the utilization of content, products, or services mentioned. Readers are advised to exercise caution before taking any action related to the company.