


- SOL fell back below the 0.382 Fib at $90.42 with all four EMAs now overhead, erasing the gains made during the early May breakout
- The 2H descending channel has held since May 13 with the Supertrend bearish at $87.30 and every bounce getting sold into on lower volume
- Longs absorbed $27.14M in 24h liquidations against just $532.56K for shorts, with retail running a 2.94 long ratio into a declining price
Solana trades at $84.60 on May 18, giving back the entire May rally as price drops below all four EMAs and the rising trendline from the February low becomes the last support standing before the 0.236 Fib at $81.62.
SOL Daily Chart: Back Below the 0.382 Fib With EMAs Flipped Bearish
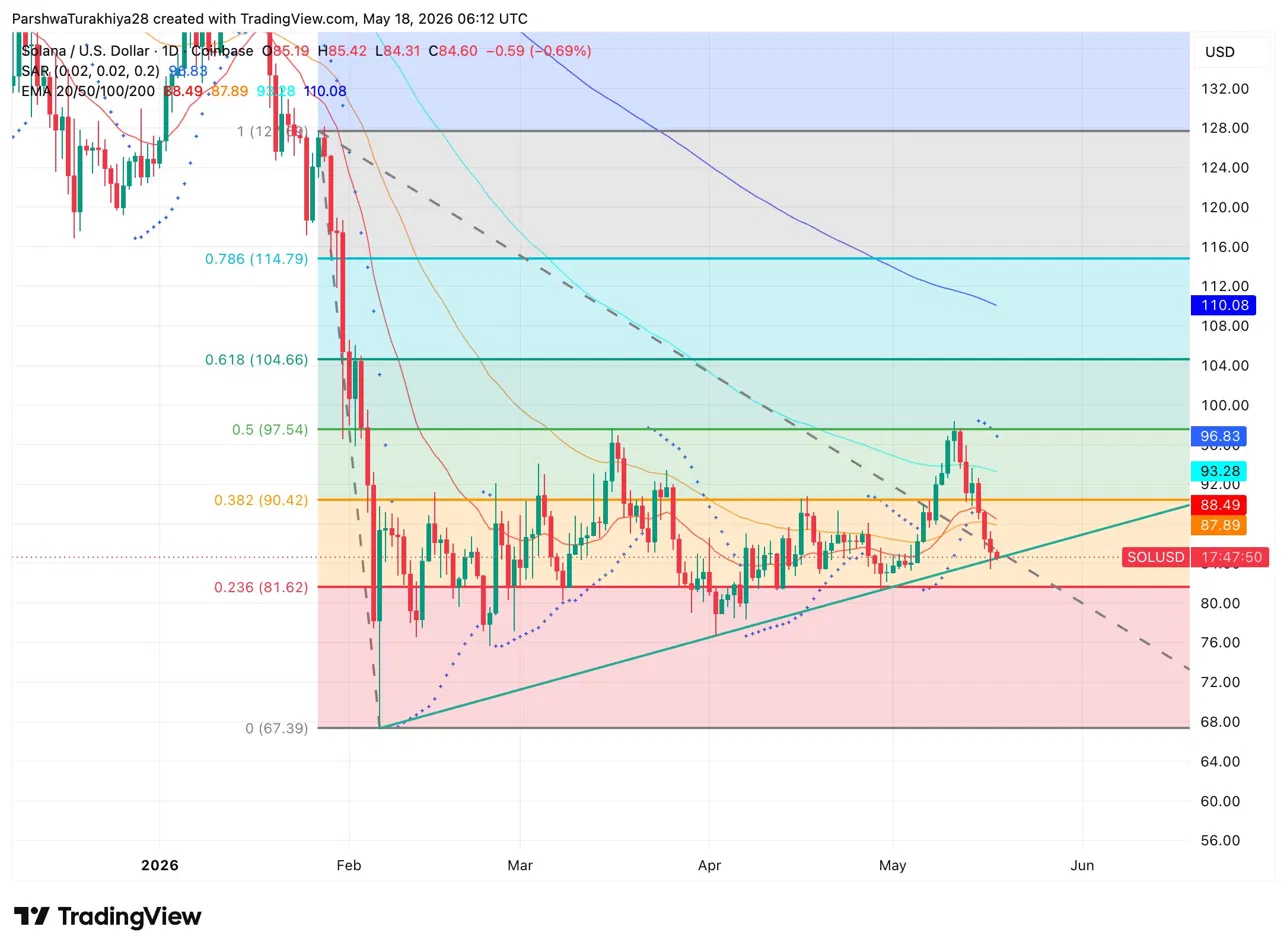
The recovery that pushed SOL above the 0.382 Fib at $90.42 in early May is fully reversed. Price is back at $84.60, below the 20 EMA at $88.49, 50 EMA at $87.89, 100 EMA at $93.28, and 200 EMA at $110.08. All four EMAs are overhead. The SAR at $96.83 is bearish and sitting well above price.
The only technical floor still intact is the rising trendline from the February low at $67.39, which is approaching current price near $84. Below that, the 0.236 Fib at $81.62 is the next meaningful support, followed by the $81 to $83 range that held through most of March and April.
SOL Key levels for May 19:
- Resistance: $87.89 (50 EMA), $88.49 (20 EMA), $90.42 (0.382 Fib), $93.28 (100 EMA)
- Support: $84 rising trendline, $81.62 (0.236 Fib), $67.39 February low
- SAR: Bearish at $96.83
SOL 2H Chart: Descending Channel With MACD Flattening at the Bottom
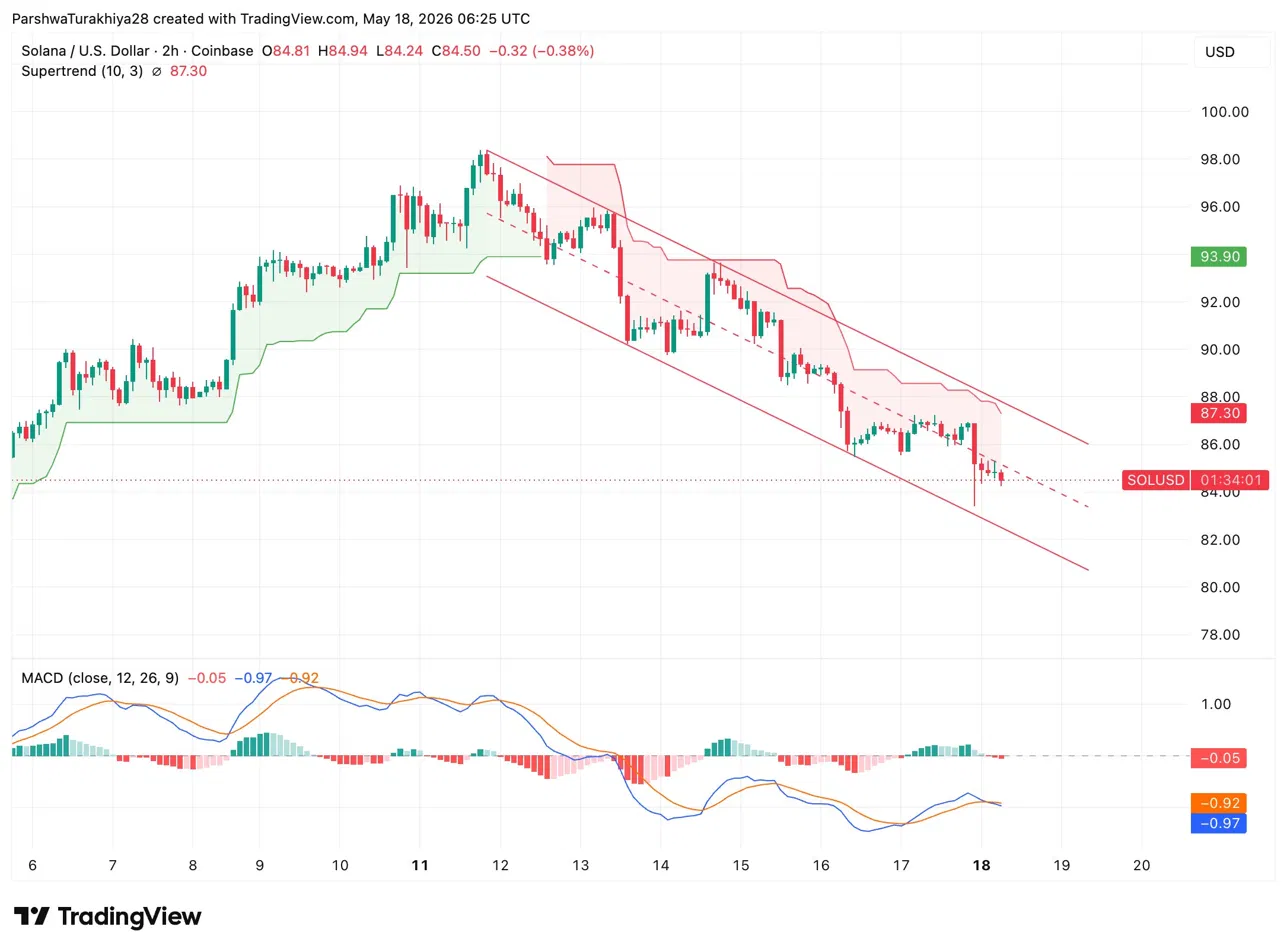
Since tagging $99 on May 12, SOL has been making lower highs and lower lows inside a descending channel on the 2H. Every bounce has been sold. The Supertrend flipped bearish at $87.30 after the May 13 drop and has not recovered since, sitting above price and capping each recovery attempt.
The MACD on the 2H is compressing near zero after an extended sell wave, with the histogram near flat. That compression at the channel bottom typically precedes a sharper move in one direction. The lower channel rail approaches $82, which converges with the 0.236 Fib on the daily and makes that $81 to $82 zone the key area to watch on any further weakness.
Key 2H levels:
- Resistance: $87.30 (Supertrend), $88 upper channel rail
- Support: $84 channel base, $82 lower channel rail
- MACD: Compressing near zero
SOL Derivatives: Retail Long Into a Falling Price
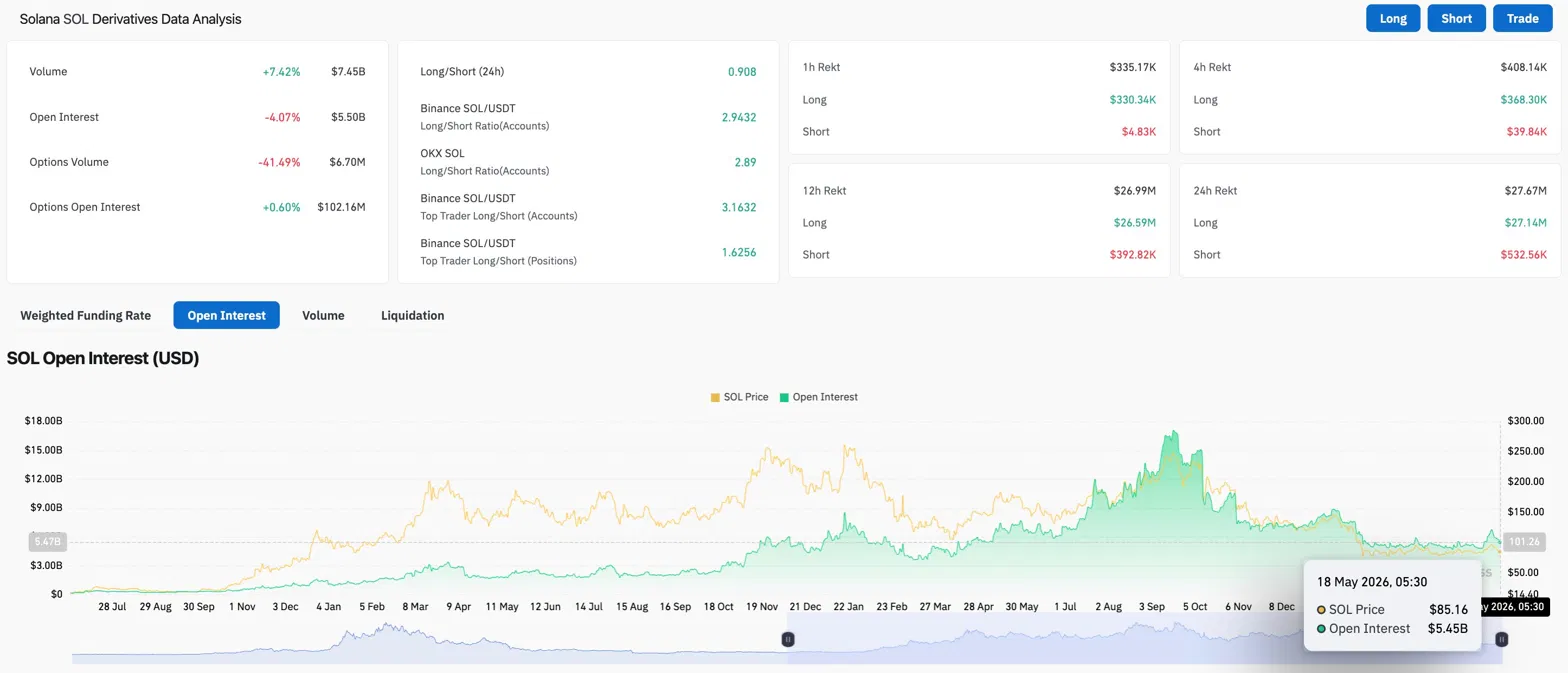
Volume rose 7.42% to $7.45B while open interest dropped 4.07% to $5.50B. Volume up with OI down means positions are closing rather than new ones being added. Retail on Binance holds a 2.9432 long ratio, OKX sits at 2.89, and top traders on Binance run 3.1632 by accounts. Heavy long bias into declining price is the setup that keeps producing liquidations rather than reversals.
Over 24 hours, $27.14M in longs were liquidated against $532.56K in shorts. Longs took more than fifty times the pain of shorts. Until that long crowding unwinds, bounces are likely to get sold before any sustained recovery takes hold.
Spot Netflow: Supply Leaving Exchanges Despite the Pullback
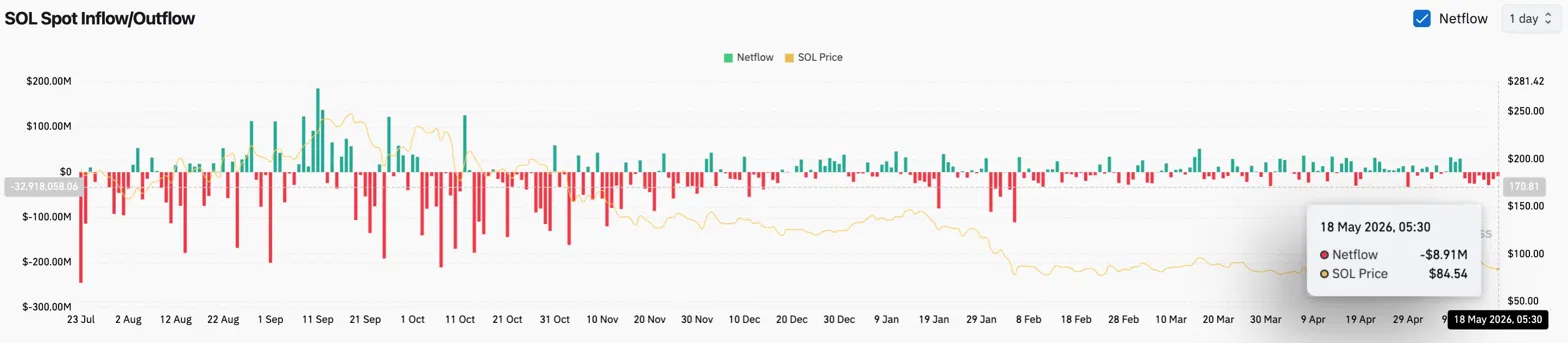
Spot netflow came in at negative $8.91M on May 18, meaning SOL is flowing into exchanges on this reading.
Zooming out, the netflow chart has been persistently negative through most of 2026, with more SOL leaving exchanges than entering over the medium term. One day of positive inflow during a price decline reflects short-term selling rather than a macro supply shift.
Solana Price Prediction: Upside and Downside for May 19
- Upside: Holding the $84 trendline and reclaiming the 50 EMA at $87.89 opens a retest of $90.42. A break above the 2H descending channel upper rail at $88 with volume would be the first genuine recovery signal since May 13.
- Downside: Losing $84 on a daily close puts $81.62 in play immediately. The lower 2H channel rail and the 0.236 Fib converging between $81 and $82 makes that zone the critical floor. A break below it opens $76 to $78 where the prior range base sits.
Disclaimer: The information presented in this article is for informational and educational purposes only. The article does not constitute financial advice or advice of any kind. Coin Edition is not responsible for any losses incurred as a result of the utilization of content, products, or services mentioned. Readers are advised to exercise caution before taking any action related to the company.

: What Happens If You Use an Unlicensed Platform?")


