


 Skyrockets to 11-Month High; Is a Correction Looming?")
- Solana soars to an 11-month high at $36.41, signaling growing investor faith in its potential.
- Rising market cap and trading volume lead to solid demand for SOL, both short-term and long-term.
- SOL’s bullish momentum eyes $40, but overbought signals hint at a potential pullback ahead.
Solana (SOL) has had an upbeat week, with bulls surging from a weekly low of $29.93 to an 11-month high of $36.41. With the cryptocurrency at its highest level since November, investors are demonstrating increasing faith in Solana’s potential.
SOL’s market capitalization and 24-hour trading volume climbed by 9.59% and 166.92%, respectively, to $15.11 billion and $1.45 billion, reflecting the cryptocurrency’s growing interest and activity.
This surge in market capitalization and trade volume indicates considerable demand for SOL, demonstrating that investors are not only optimistic about its short-term success but also about its long-term potential in the cryptocurrency market.
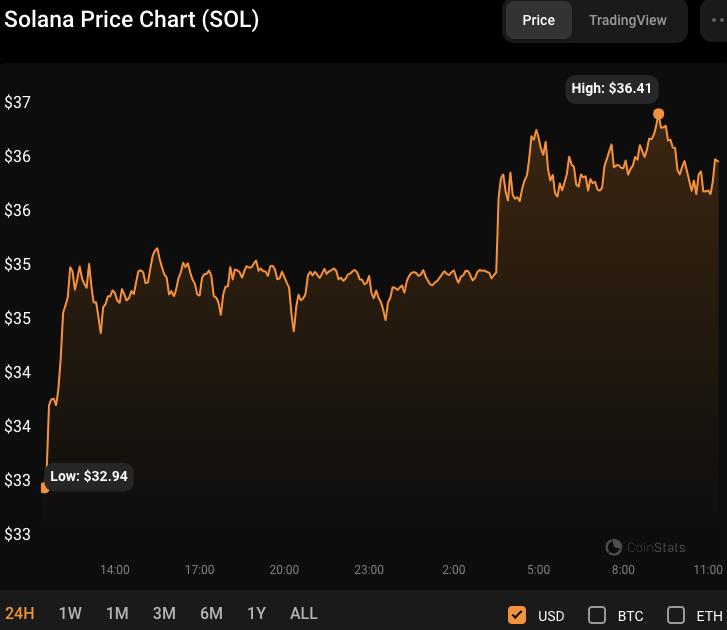
Significantly, bullish dominance managed to influence SOL prices between $35.7 and $32.53 in the previous 24 hours, signaling significant purchasing pressure in the market as investors continue to accumulate SOL tokens.
If the bullish momentum breaks over the $36.41 barrier, the psychological level of $40 might be the next target for SOL. This level would reaffirm the positive attitude around Solana, potentially attracting additional investors.
Conversely, if the price fails to break past the barrier, a consolidation period or modest correction may ensue before another effort to hit new highs. If the trend turns negative, however, SOL’s price might drop below $32 or $30 before recovering.
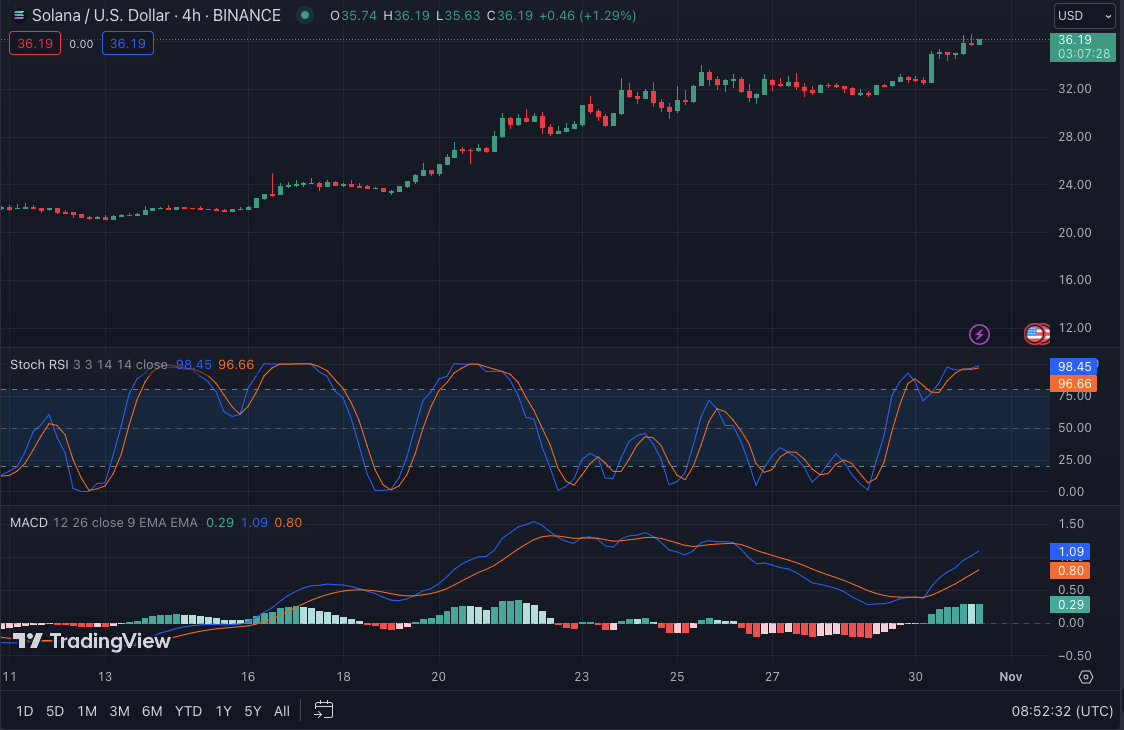
SOL/USD Technical Analysis
The Moving Average Convergence Divergence (MACD) trend in the positive zone with a rating of 1.09 on the SOLUSD 4-hour price chart indicates bullish, solid momentum. This pattern shows that buyers are in control and that SOL’s price can increase. The histogram also shows positive momentum, with rising bars suggesting a stronger bullish trend.
The stochastic RSI rating of 98.45, on the other hand, implies that SOL is now overbought and may be ready for a short-term pullback. This degree of overboughtness suggests that the price is approaching a point of exhaustion, which might result in a brief retreat or consolidation.
As a result, traders should be cautious and consider taking profits or using risk management methods to shield themselves from a future downturn.
In conclusion, Solana’s impressive surge to an 11-month high reflects growing investor confidence, but caution is advised as overbought signals hint at a potential short-term pullback.
Disclaimer: The information presented in this article is for informational and educational purposes only. The article does not constitute financial advice or advice of any kind. Coin Edition is not responsible for any losses incurred as a result of the utilization of content, products, or services mentioned. Readers are advised to exercise caution before taking any action related to the company.
 Price Prediction 2026-2030: Will TRX Hit $0.50 Soon?")
 Price Prediction 2026-2050: Will HYPE Hit $100 Soon?")


: What Happens If You Use an Unlicensed Platform?")