


: Why This Price Could Be a Perfect Buying Point")
- SOL has recovered from its June plunge, thanks to increased demand for the token.
- At $19, the token offers a buying opportunity for mid to long-term traders.
- Buying pressure remained high, so profit-taking might not lead to a significant price dip.
During June, Solana (SOL) plugged six major red candles on the daily timeframe, as the token continually failed to nullify the desires of bears. However, buying momentum at $14.08 was able to savor what was left of the plunge, as bulls pushed to $17.48 in less than seven days.
Consequently, SOL became the second most profitable cryptocurrency out of the top ten over the last week. The token outperformed Bitcoin (BTC), and Ethereum (ETH), as it only fell behind halving-destined Litecoin (LTC).
Bears Are Out of Dominance
As it stands, bears may have a problem taking bulls out of control. Even though there have been mild sell-offs in between SOL’s rise to $19.66, the Awesome Oscillator (AO) seemed to support a bullish narrative.
At the time of writing, the AO was 1.79 after a glaring attempt at creating a bullish twin peak. By using the difference between the 34 and 5-period Simple Moving Average (SMA), the basic interpretation of the reading below suggests that an uptrend could be in place.
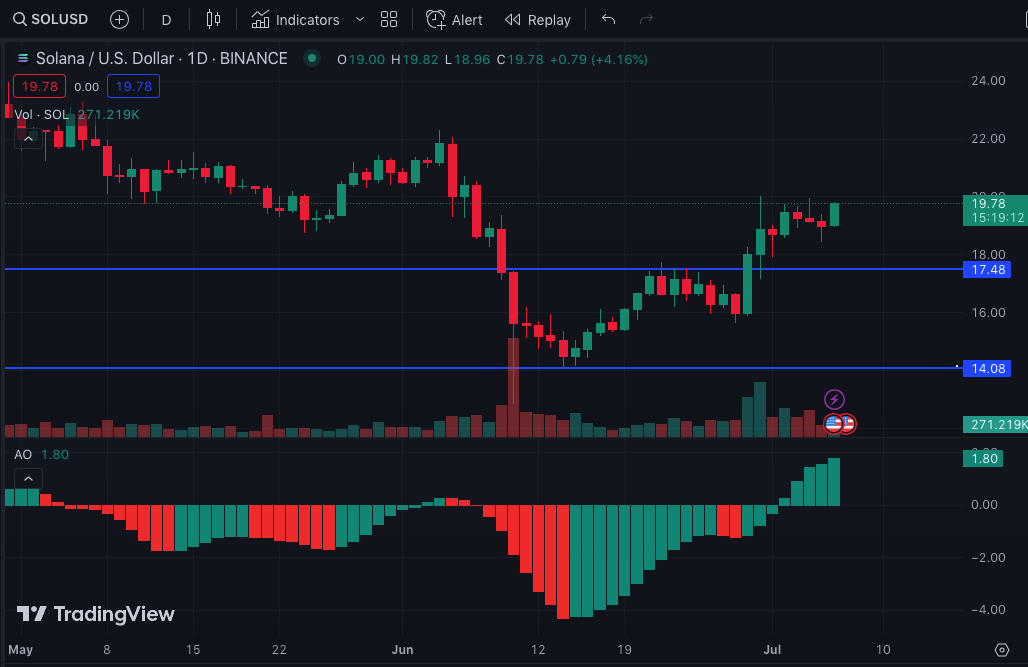
Also, the consecutive higher green bars suggest that the current SOL price could be a point to accumulate if participants were to hold for the mid-term.
The Next Direction Could Be North
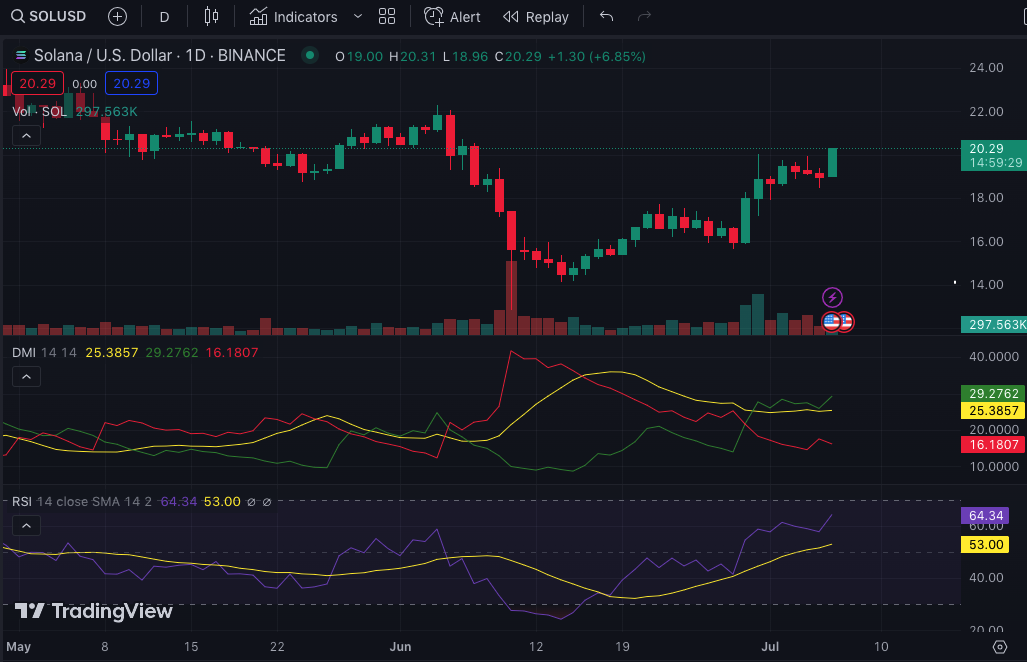
The Directional Movement Index (DMI) also aligned with the indications from the AO. From the daily chart, the +DMI (green) was 29.27. Conversely, the -DMI (red) was 16.18 while facing downwards.
Although the +DMI seemed to have stabilized at the point mentioned above, it still means that buyers controlled the market. This indicator also had the support of the Average Directional Index (ADX).
As of this writing, the ADX (yellow) was 25.38. Since the ADX was not less than 25, it suggests that the +DMI directional strength was much more than the -DMI. So, bulls may continue to enjoy the ride unless faced with high selling pressure.
Furthermore, the Relative Strength Index (RSI) indicated that SOL’s momentum might continue to dominate. This was because the RSI was 64.21, signaling high demand and buy orders. But if the indicator reaches 70, then profit-taking might occur and SOL’s uptrend might cool down.
In conclusion, SOL’s price may have to deal with a slight decrease considering the gains recorded lately. However, the token might continue to build upon its uptrend in the coming days as a sharp fall in value doesn’t seem likely.
Disclaimer: The views, opinions, and information shared in this price prediction are published in good faith. Readers must do their research and due diligence. Any action taken by the reader is strictly at their own risk. Coin Edition and its affiliates will not be liable for direct or indirect damage or loss.
Disclaimer: The information presented in this article is for informational and educational purposes only. The article does not constitute financial advice or advice of any kind. Coin Edition is not responsible for any losses incurred as a result of the utilization of content, products, or services mentioned. Readers are advised to exercise caution before taking any action related to the company.
 Price Prediction: Can BTW Sustain Its Breakout Above $0.1032?")


