


- S&P 500 weekly closes surge above $7,000, the NASDAQ above $24,000, and BTC surges on institutional inflows.
- Soft US inflation data and strong SPX BTC correlation fueled short squeezes and a risk-on equity rally.
- This raises questions about whether it is a bull market or a bull trap, and whether it could extend gains or trigger a pullback.
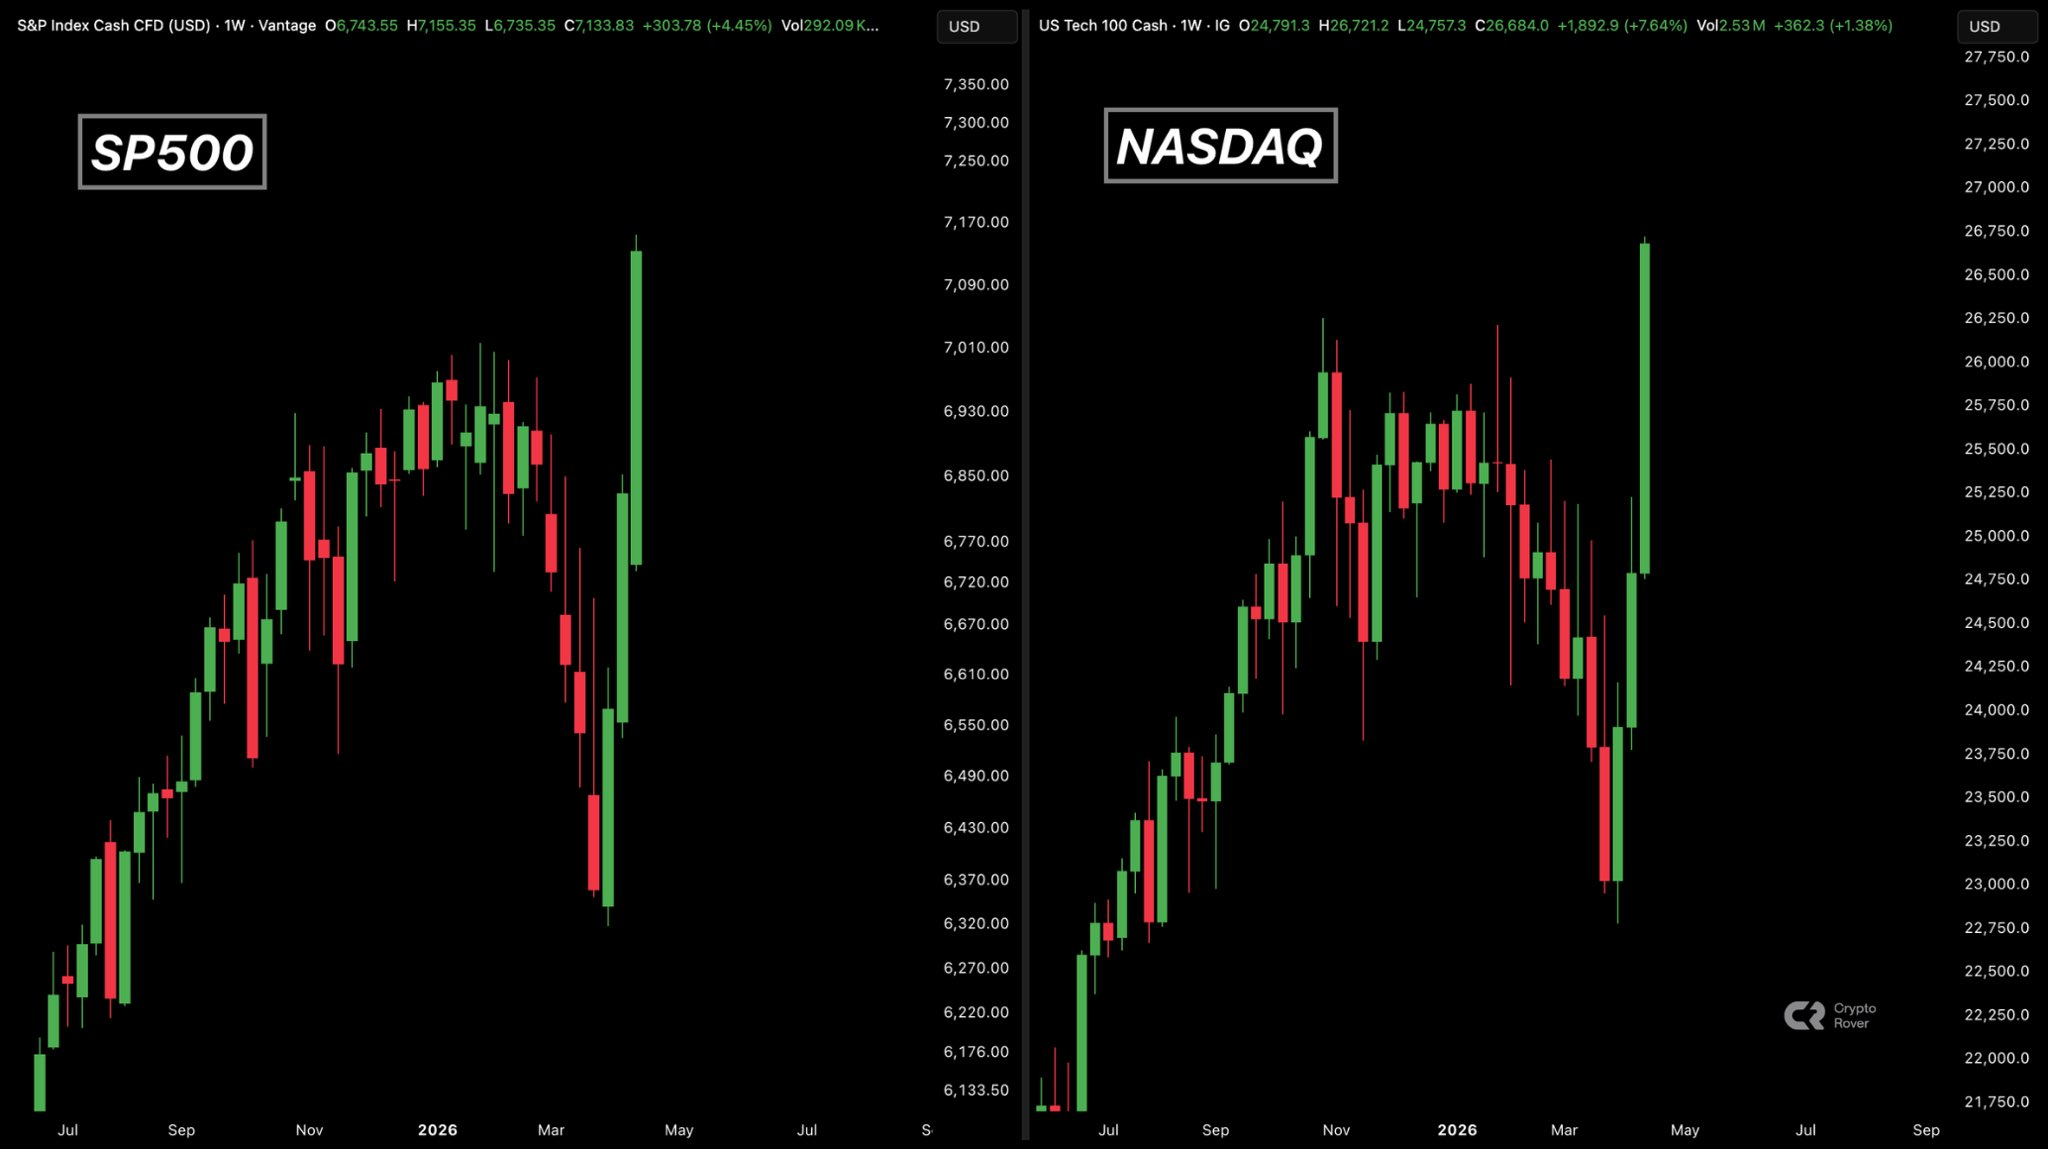
On April 18, 2026, the S&P 500 and NASDAQ closed at their highest weekly candles ever as the U.S. stock market soared, fueling new all-time highs above $ 7,000 for the S&P and $24,000 for the NASDAQ.
Bitcoin (BTC) also mirrored the equity market’s strength, with a solid weekly close, trading firmly above the $75,400 to $75,800 range on Friday, supported by positive ETF inflows and short covering as geopolitical fears eased.
SPX, NASDAQ, and BTC Post Strong Bullish Weekend Closes
The S&P 500 and NASDAQ both posted their highest weekly green candles on record for the week ending April 17, 2026, closing at fresh all-time highs amid a powerful risk-on rebound. S & P 500 surged 4.5%, up 309.17 points for the week, finishing above $7,126.06, its third straight record close.
Meanwhile, NASDAQ surged 6.8%, gaining 1,565.59 points for the week and closing above $24,468.48. It recorded its 13th consecutive daily gain, the longest winning streak since 1992, and also sealed a record weekly close.
Source: X
Bitcoin (BTC) mirrored the equity market’s strength with a solid weekly close, extending gains of approximately 6% for the period and trading firmly above the $75,000 level into the weekend, around the $75,400–$75,800 range on Friday. This came alongside positive ETF inflows and short covering as geopolitical fears eased.
Soft Inflation and BTC Correlation Fuel the Rally
Softer-than-expected core inflation in the March 2026 CPI report released on April 10 triggered the rally. Headline CPI rose 3.3% year-over-year, driven entirely by a 21.2% surge in gasoline prices from the Iran oil shock. Core CPI, however, increased just 0.2% month-over-month and 2.6% year-over-year, both below forecasts. Markets saw the energy spike as temporary, not broad-based pressure.
Meanwhile, BTC’s tight correlation with equities has amplified the move. BTC climbed in lockstep from the $68K–$72K range to above $75K by the weekend close, driven by the risk-on sentiment, ETF inflows, and hundreds of millions in short liquidations. Macro tailwinds and equity spillover confirmed a synchronized rally.
What’s Next for BTC and Equities Amid April 2026 Rally?
Equities could face a momentum-driven grind higher in the coming weeks, with the S&P 500 likely consolidating above the $6,900-7,000 support range before testing fresh records near $7,200. Overbought RSI signals suggest a mild pullback, but easing geopolitical risks and strong earnings keep the path of least resistance bullish. Range-bound volatility could persist through May unless new catalysts emerge.
BTC rides the risk-on wave, targeting $78K–$82K if it clears $76K–$77K resistance cleanly. ETF inflows and regulatory tailwinds from the CLARITY Act provide support, while April seasonality favors upside. Equities-led consolidation could test $70K support, but the macro setup points to continued catch-up gains.
Therefore, the broader outlook blends bullish liquidity with caution over potential exhaustion. Both assets could continue to benefit in this environment, although profit-taking could trigger a 5 to 8% pullback. Market participants are now watching the S&P 500 near $7,100 and BTC $80K for confirmation of the next leg higher into summer, balancing opportunity with disciplined risk management.
Related: James Wynn Liquidation Leaves $100M Account Nearly Wiped Out
Disclaimer: The information presented in this article is for informational and educational purposes only. The article does not constitute financial advice or advice of any kind. Coin Edition is not responsible for any losses incurred as a result of the utilization of content, products, or services mentioned. Readers are advised to exercise caution before taking any action related to the company.
 Price Prediction: Can BTW Sustain Its Breakout Above $0.1032?")


