

- Stablecoin supply added about $2.23 billion in seven days and reached $303.1 billion.
- USDT controlled 60.43% of the stablecoin market, equal to roughly $183 billion.
- Ethereum stablecoin supply fell by about $80 million while the total market expanded.
Stablecoin supply has returned above $303 billion, giving crypto markets a larger pool of dollar-linked assets. Yet the total does not show how much capital is reaching exchange order books or risk assets.
USDT controlled 60.43% of supply. Those figures describe available settlement capital, but they do not confirm buying across Bitcoin, Ether, or altcoins.
Stablecoin Supply Expands After a Long Market Recovery
DefiLlama’s market chart shows a weekly increase of roughly $2.23 billion. The total reached about $303.1 billion when the chart was captured.
That level followed several years of uneven movement. Supply expanded sharply during 2021, declined through much of 2022 and 2023, and then recovered in 2024. The curve moved above $300 billion during 2026 before retreating from its recent peak.
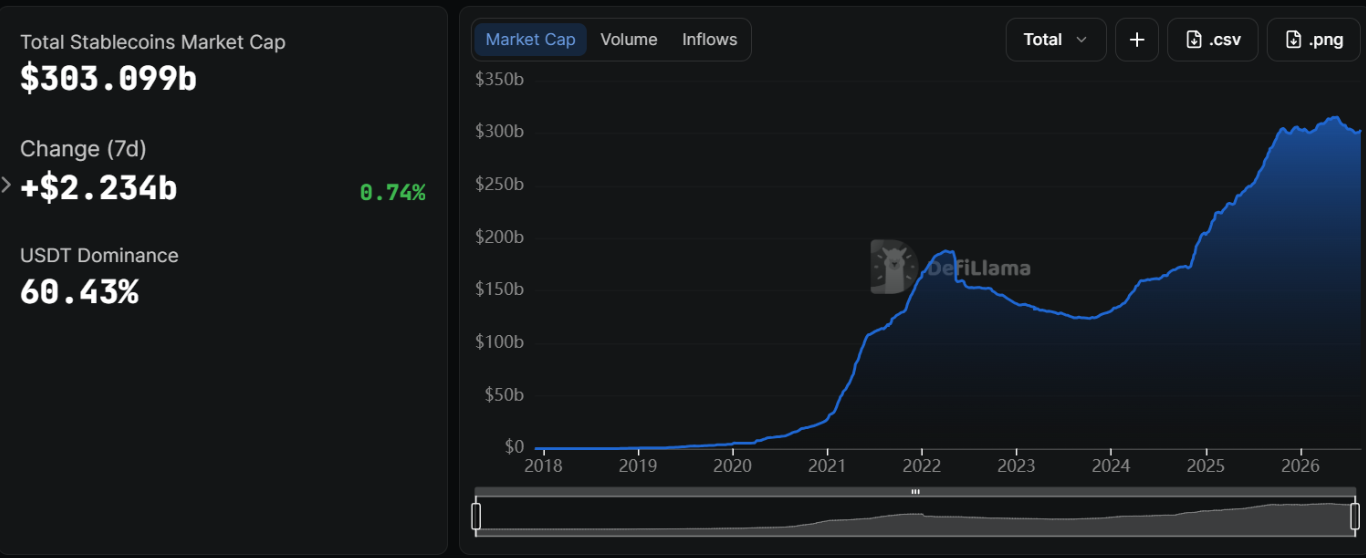
DefiLlama data placed USDT’s market value near $183.13 billion. USDC ranked behind it with approximately $73.67 billion. Together, both tokens represented most of the market’s dollar-linked supply.
USDC gained 2.29% during the week, while USDT increased only 0.04%. The smaller token therefore supplied more of the latest market growth in dollar terms.
New issuance does not automatically become demand for volatile assets. Stablecoins also serve payments, remittances, lending markets, collateral positions, exchange settlement, and decentralized finance applications.
The Cambridge Centre for Alternative Finance warns that supply growth cannot confirm adoption or activity by itself. Cambridge also tracks transfer values, transaction counts, users, and velocity.
Ethereum Stablecoin Supply Shows Uneven Distribution
Meanwhile, the Ethereum chart presents a different pattern. Stablecoin supply on the network stood near $147.05 billion and declined by roughly $80 million. The weekly change equaled about 0.05%.
Ethereum’s monthly stablecoin balance also fell 1.33%, adding a longer decline to the weekly move shown in the chart.
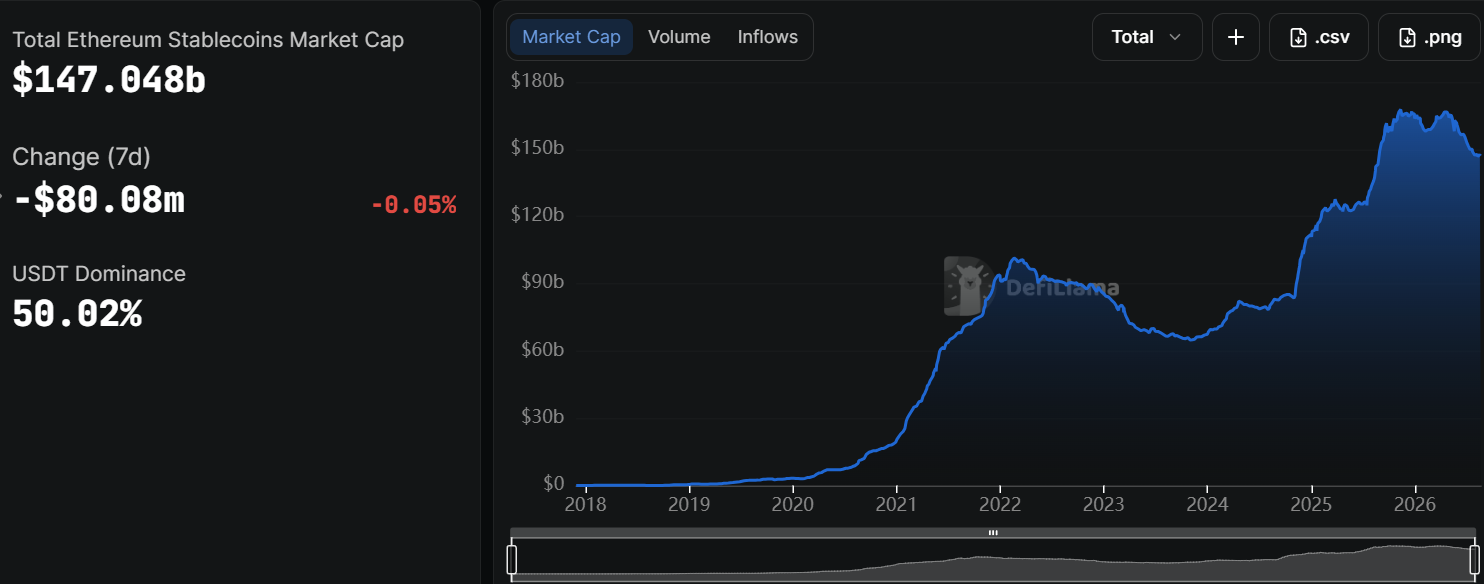
USDT made up 50.02% of stablecoin dominance on Ethereum. It accounted for nearly half of total stablecoins on the network, yet it didn’t register the broad weekly rise.
That division would signal that new crypto liquidity wasn’t spread throughout chains. Assets could remain on Tron, Solana, or even the more established layer-one protocols and non-custodial platforms or in payment services/issuer addresses.
Notably, location also affects how quickly balances can reach traders. CryptoQuant-based reporting placed centralized exchange reserves near $64 billion, down from approximately $80 billion in late 2025.
Binance reportedly controlled 68.5% of those exchange balances. The concentration leaves other venues with a smaller share of immediately accessible stablecoins. Decentralized exchanges and private wallets are not fully represented by that centralized exchange measure.
Bitcoin and ETF Flows Provide Partial Price Confirmation
Bitcoin’s chart showed a price near $77,273 and a market value around $1.55 trillion. Reported daily trading volume reached $98.06 billion, while open interest stood near $32.86 billion.
BTC recovered from the $60,000 region and cleared $75,000 during its latest advance. This movement confirms demand reached Bitcoin, although it does not identify stablecoin issuance as the main funding source.
Institutional flows provide another source of buying. SoSoValue figures showed spot Bitcoin funds attracted $1.92 billion across five sessions. Ether products added $697.47 million during the same period.
The two ETF groups received about $2.62 billion combined. WhaleFactor also reported more than $7.5 billion in Bitcoin and Ether ETF volume over 24 hours.
ETF purchases use traditional brokerage cash rather than requiring on-chain stablecoins. Their strength confirms institutional demand, but it cannot prove that the new stablecoin supply entered spot crypto markets.
Bitcoin’s next market reaction will shed light on liquidity indicators. Keeping support above the most recent breakout would suggest that buyers are absorbing profit-taking. A stagnant price, adjacent to increases in stablecoin supply, would confirm sellers matching existing interest.
USDT Dominance Offers a Conditional Liquidity Signal
Meanwhile, the majority stablecoin liquidity provider has USDT at 60.43% market share, and an increasing trend in this value can fuel active quote markets when Bitcoin and Ether rally concurrently.
The high share could also indicate that traders remain in defensive mode and prefer to convert tokens to USDT rather than to take fiat money out of exchanges during extreme price swings.
Derivatives positioning adds another risk measure. Binance perpetual data shared by KriptoHolder placed Bitcoin longs at 50.74%, within the 14.6th historical percentile.
Ether longs reached 72.14%, placing the reading within the 96.1st percentile. That concentration shows heavier bullish leverage in Ether, which can increase forced selling during a downward move.
Traders can compare stablecoin inflows with spot volume, exchange reserves, chain activity, and decentralized exchange turnover. Wider altcoin demand would require those measures to strengthen beyond Bitcoin.
Contracting supply would reduce the market’s dollar-linked base. A simultaneous decline in exchange reserves would leave less immediately available capital to meet selling pressure.
Related: Bitcoin Eyes $100K After Shallow Pullback as Institutional Demand Returns
Disclaimer: The information presented in this article is for informational and educational purposes only. The article does not constitute financial advice or advice of any kind. Coin Edition is not responsible for any losses incurred as a result of the utilization of content, products, or services mentioned. Readers are advised to exercise caution before taking any action related to the company.