





- Solana price prediction stays bullish above $114.43, targeting $125 first and $135 next
- Fiserv’s digital asset platform went live with Roughrider Coin, a stablecoin processed on Solana
- US spot Solana ETFs posted 13 straight weekly inflows, including $188.22 million in the week ending September 25
Solana price prediction for October stays bullish above $114.43, the level SOL needs to hold to keep its rising channel intact.
Solana Price Analysis: Can SOL Reach the $135 Channel Top in October?
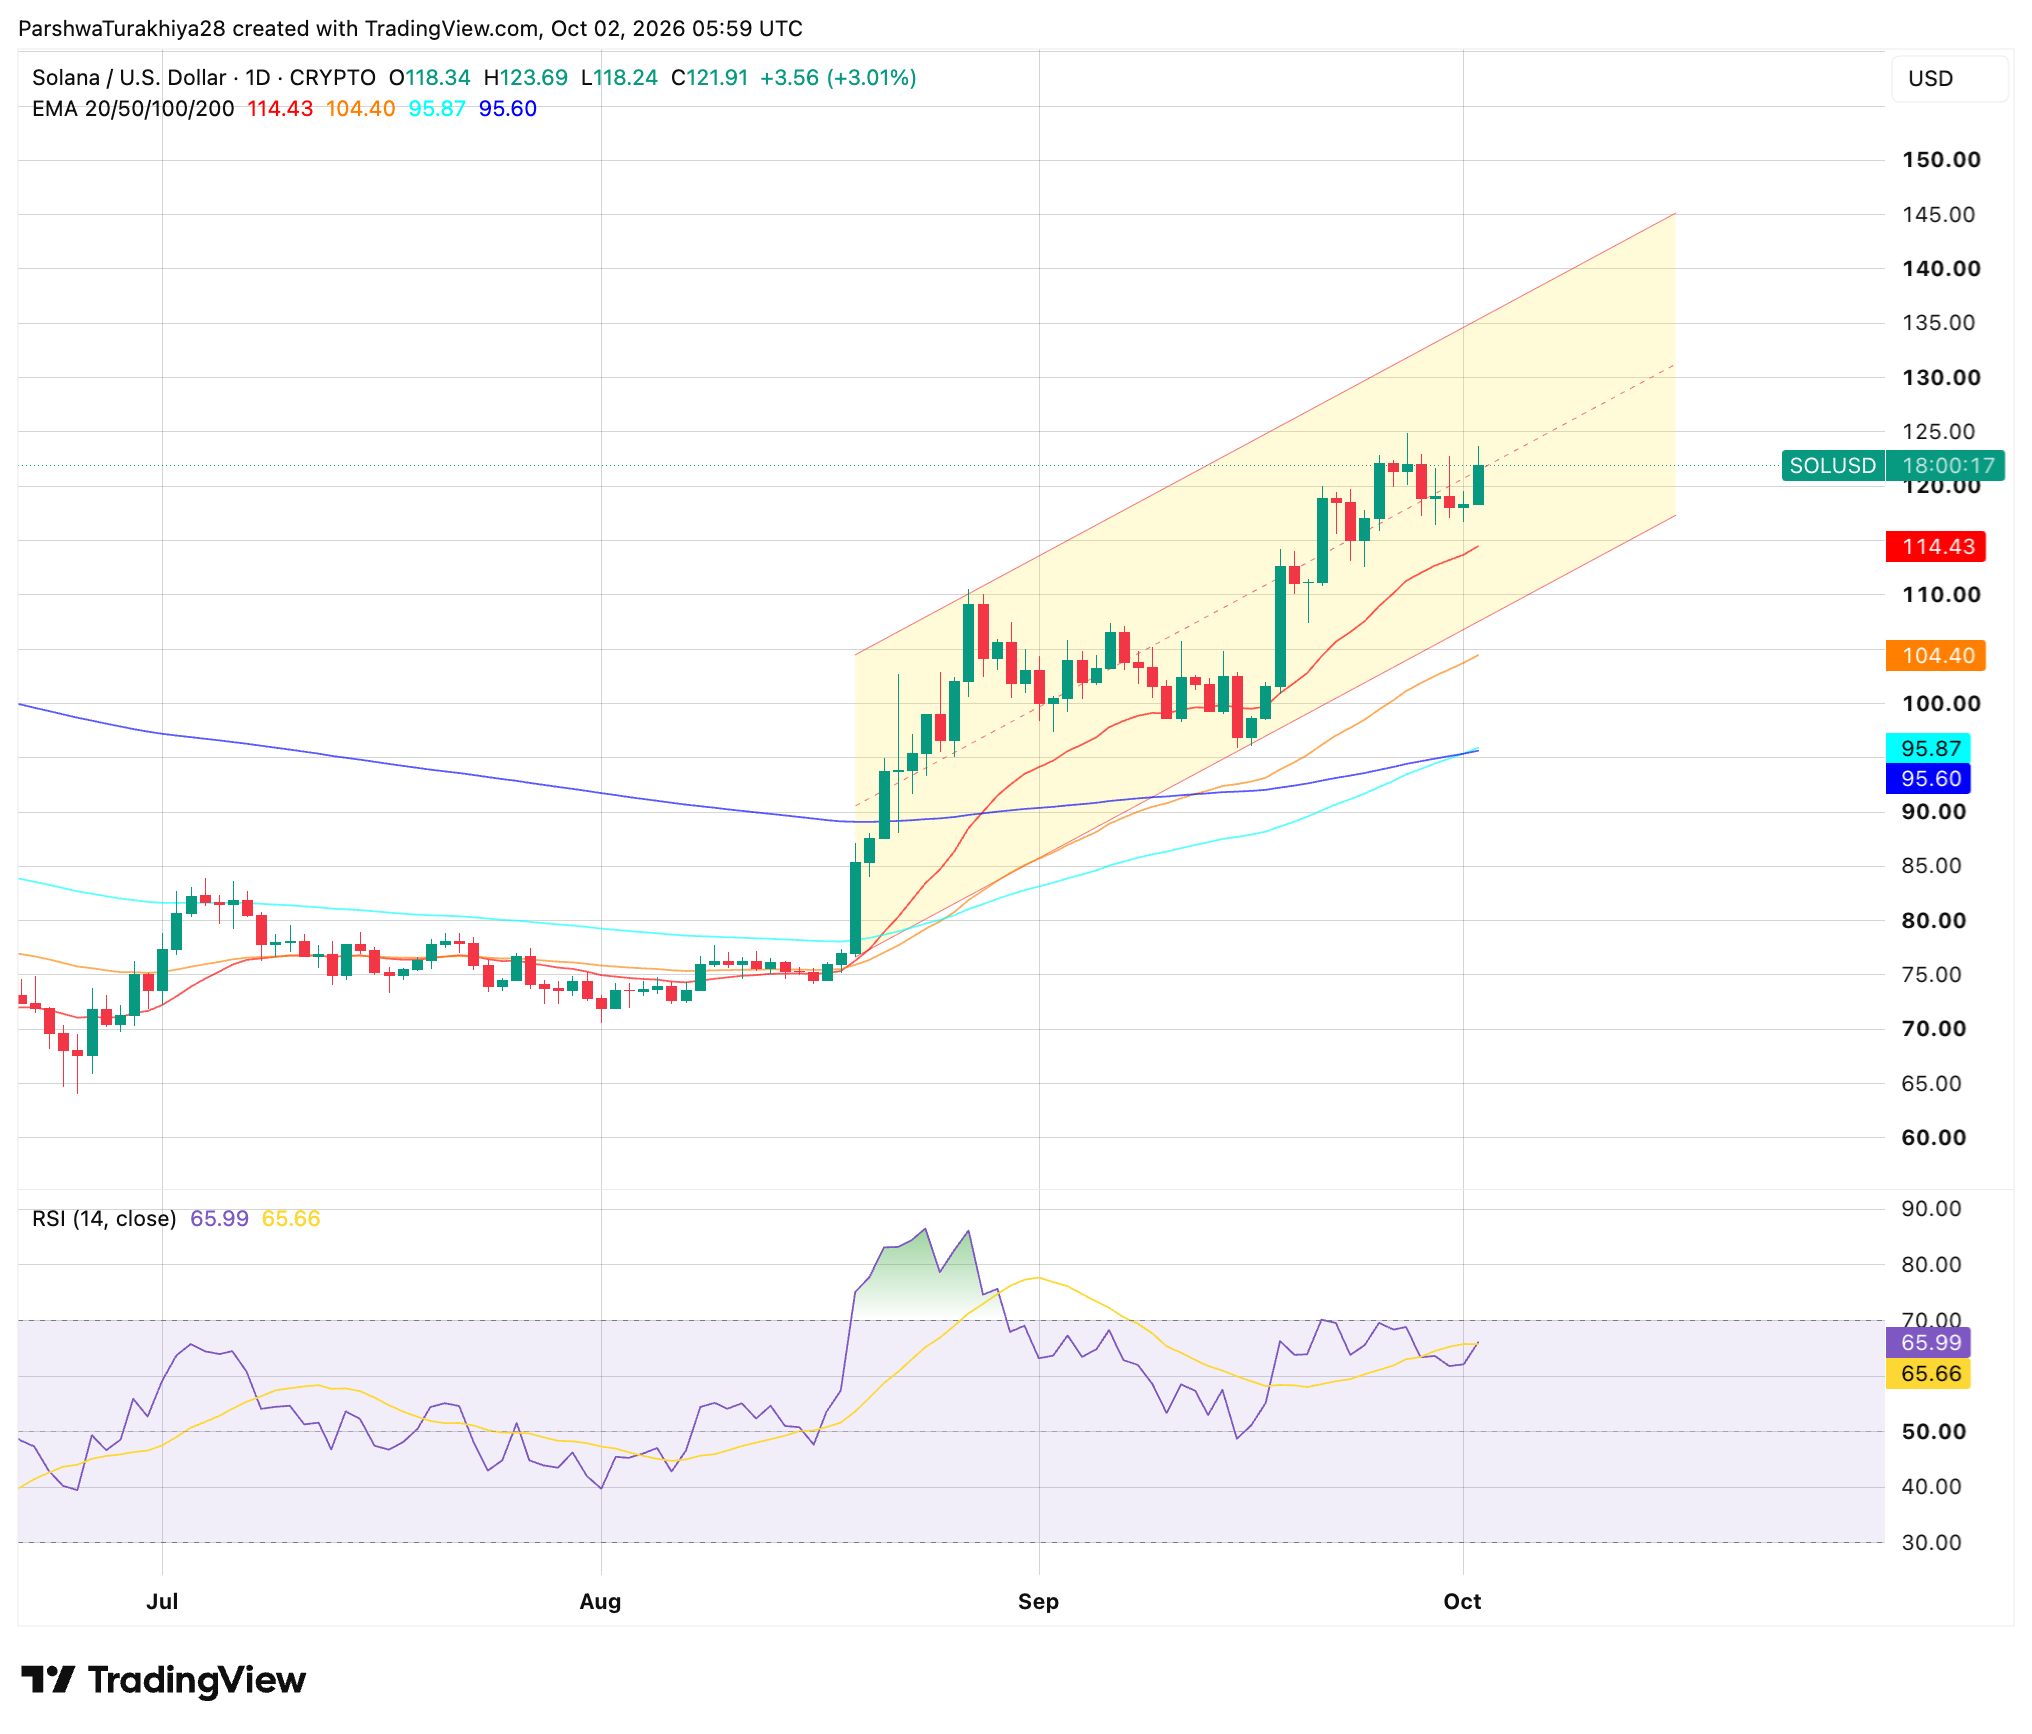
SOL trades near $121.91, up 3.01% today, on the midline of a rising channel that has guided price since the mid-August breakout, and the upper edge near $135 is about 11% away. The late-September high near $125 sits on the way there and has capped the past week, so a daily close above it would open the path to the channel top, which climbs toward $145 by mid-October.
Support starts at the 20-day EMA at $114.43, followed by the channel’s lower edge near $108 and the 50-day EMA at $104.40. The 100-day EMA at $95.87 sits just above the 200-day at $95.60, and RSI at 65.99 remains below 70 after peaking above 80 in late August, which leaves room for another push before momentum looks stretched.
Related: Chainlink Price Prediction October 2026: Can LINK Hold Its August Breakout Through October?
SOL Support and Resistance Levels, October 2026
| Type | Price |
| Resistance | $125 |
| Resistance | $135 |
| Resistance | $145 |
| Support | $114.43 |
| Support | $108 |
| Support | $104.40 |
Solana October Seasonality: Three Gains in Six Years
SOL has closed October higher in three of the six completed years since 2020, with an average gain of 12.5% and a median of 4.48%. The 80.1% jump in 2023 and the 43.1% gain in 2021 lift the average, while October 2020 fell 46.7%, so the median is the better guide. The last two Octobers split, with a 10.6% gain in 2024 and a 10.3% loss in 2025.
SOL is up 14.6% in September 2026 against a September median of 8.22%, following a 41.4% gain in August, so this October opens after two strong months. Applied to the current price of $121.91, the median October return implies about $127.37 and the average about $137.18, both historical references rather than targets.
| Year | October Return |
| 2026 (month to date, excluded) | +3.35% |
| 2025 | -10.3% |
| 2024 | +10.6% |
| 2023 | +80.1% |
| 2022 | -1.65% |
| 2021 | +43.1% |
| 2020 | -46.7% |
| Average (2020 to 2025) | +12.5% |
| Median (2020 to 2025) | +4.48% |
SOL News: Fiserv’s Digital Asset Platform Goes Live With a Solana-Based Stablecoin
Fiserv said on October 1 that its digital asset platform is live with bank clients, with Roughrider Coin as the first use case. Roughrider is a dollar-backed stablecoin from the Bank of North Dakota, issued by VersaBank, with Fireblocks providing the infrastructure and transactions processed on Solana. More than 90 North Dakota banks and credit unions can use it for bank-to-bank transfers through Fiserv’s Commercial Center online banking system, and Fiserv’s Sunil Sachdev said the launch moves the platform “from concept to production.”
Related: Dogecoin Price Prediction: Can DOGE Clear $0.10 in October as ETF Inflows Return?
For SOL holders, the signal is that a large payments technology provider is running a live stablecoin on Solana rather than a pilot, though the scale is limited to one state’s interbank network. The release is Fiserv’s own, and it names Solana only as the processing network, with no transaction volumes and no link to demand for the SOL token.
SOL News: Tokenized Stock Trading on Solana Hits a Record $4.35 Billion
The Tokens on Solana account reported on X that spot trading of tokenized stocks on Solana reached a record $4.35 billion in September, 3.4 times August’s volume and 24% above the previous monthly high.
Those ratios imply about $1.28 billion in August and a prior record near $3.51 billion.
SOL ETF Flows: A 13-Week Inflow Streak Meets a $5.91 Million Daily Outflow
US spot Solana ETFs took in $188.22 million in the week ending September 25, the largest weekly inflow in the visible table, which starts in mid-June, and the 13th straight weekly gain after a $1.81 million outflow in the week ending June 26 according to SoSoValue. The streak has added about $475.77 million, and cumulative net inflows now stand at $1.61 billion with total net assets at $1.91 billion.
The current week is at $1.13 million with Friday still to report, after Thursday’s $5.91 million net outflow. Bitwise’s BSOL lost $6.51 million and Canary’s SOLC $4.78 million, which outweighed a $5.38 million inflow into Grayscale’s GSOL.
Solana Price Prediction for October 2026: Week-by-Week Outlook
| Period | Expected Range | Key Levels |
| Oct 1 to 7 | $114 to $126 | The 20-day EMA at $114.43 needs to hold on dips, with $125 as the first hurdle. |
| Oct 8 to 14 | $112 to $135 | A close above $125 opens the channel’s upper edge near $135, while a loss of $114.43 brings the channel floor into play. |
| Oct 15 to 21 | $112 to $145 | The upper edge reaches about $145 by mid-month, and the floor rises to about $118, so a break below it would end the rising structure. |
| Oct 22 to 31 | $104 to $145 | The October 28 Fed decision sets the tone, with $145 as resistance and the 50-day EMA, now at $104.40, as support. |
Solana Price Prediction: Bullish and Bearish Scenarios for October
Bullish Case, Target: $135
SOL holds the 20-day EMA at $114.43 and closes a day above the $125 late-September high, which opens the channel’s upper edge near $135. Renewed ETF inflows after this week’s slowdown would confirm the move, with Fiserv’s live platform adding to the institutional use case.
Bearish Case, Risk Level: $104.40 (50-Day EMA)
SOL loses the 20-day EMA at $114.43 and the channel floor near $108, which would break the rising channel. A daily close below the 50-day EMA at $104.40 would expose the 100-day and 200-day EMAs near $95.87 and $95.60, and a run of ETF outflows would fit that scenario.
Solana Price Prediction FAQs
SOL could extend toward $125 and then $135 in October if it holds above $114.43 and closes above $125. A daily close below the 50-day EMA at $104.40 would put the 100-day EMA at $95.87 in play.
$150 would need a gain of about 23% from $121.91, which two of the six completed Octobers matched or beat, in 2021 and 2023. $200 would need about 64%, which only 2023 matched at 80.1%, and the rising channel’s upper edge is only near $145 by mid-month, so $200 is unlikely from the current setup.
Yes, if it loses the channel floor near $108 and the 50-day EMA at $104.40. $100 is a drop of about 18%, and only one of the six completed Octobers fell by more, 46.7% in 2020. The 100-day and 200-day EMAs near $95.87 and $95.60 sit just below that level.
SOL closed October higher in three of six completed years from 2020 through 2025, with an average gain of 12.5% and a median of 4.48%. The 80.1% gain in 2023 lifts the average, and the last two Octobers split, with a 10.6% gain in 2024 and a 10.3% loss in 2025.
Disclaimer: The information presented in this article is for informational and educational purposes only. The article does not constitute financial advice or advice of any kind. Coin Edition is not responsible for any losses incurred as a result of the utilization of content, products, or services mentioned. Readers are advised to exercise caution before taking any action related to the company.




