


- Bullish sentiment in the ETH market may rise due to increased staking rewards.
- However, the bearish trend is strengthening with negative KST and MFI readings.
- Additionally, the converging Bollinger Bands suggest a potential price surge.
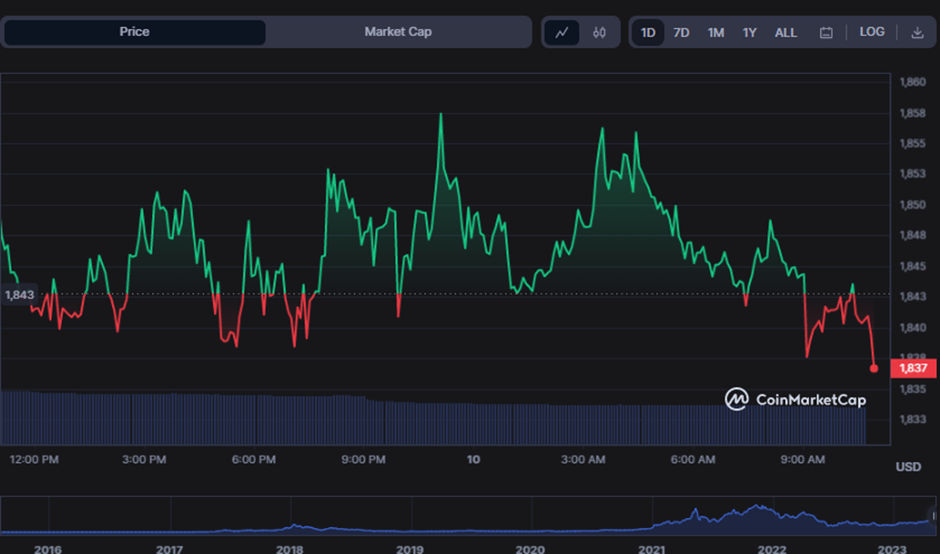
In the last 24 hours, bulls have dominated the Ethereum (ETH) market, with prices oscillating between a support level of $1836.77 and a resistance level of $1860.67. Despite their efforts, the bulls could not break through the resistance level, resulting in a 0.58% decline to $1839.07 at press time.
However, with the recent surge in staking rewards and income for validators fueled by the meme coin frenzy, there is potential for increased bullishness in the Ethereum market. As investors take note of the platform’s earning potential, this could attract new buyers and drive up demand for ETH, potentially pushing prices higher soon.
During the downturn, ETH’s market capitalization and 24-hour trading volume fell by 0.46% and 30.25%, respectively, to $221,244,568,110 and $5,842,359,111.
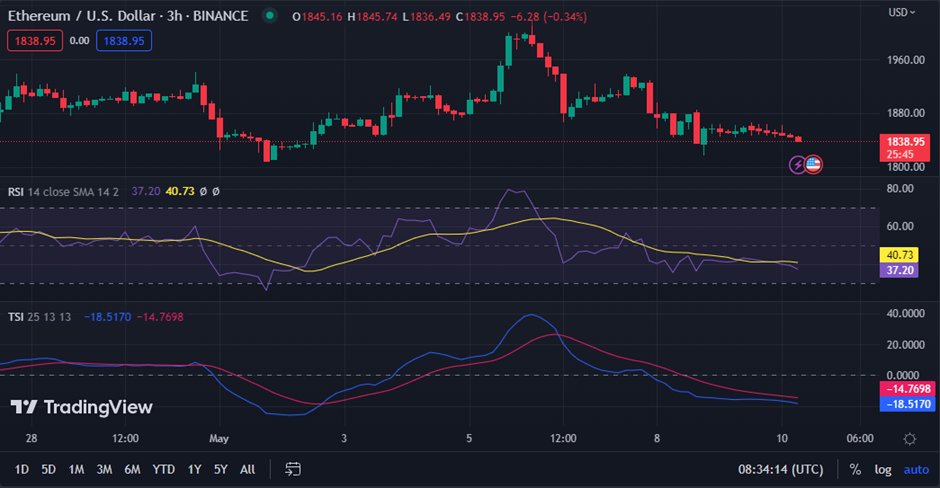
The 3-hour ETH/USD chart’s RSI is at 37.08, below its signal line, indicating a strengthening bearish trend. While it hasn’t crossed the “30” threshold, traders should remain cautious and set stop loss orders as there is still potential for a further bearish rally.
The ETH market is feeling the bearish heat, with the Know Sure Thing (KST) index at a chilly -18.5032, slipping below its signal line. The negative KST reading and its position below the signal line suggest that the bearish trend in the ETH market is gaining strength.
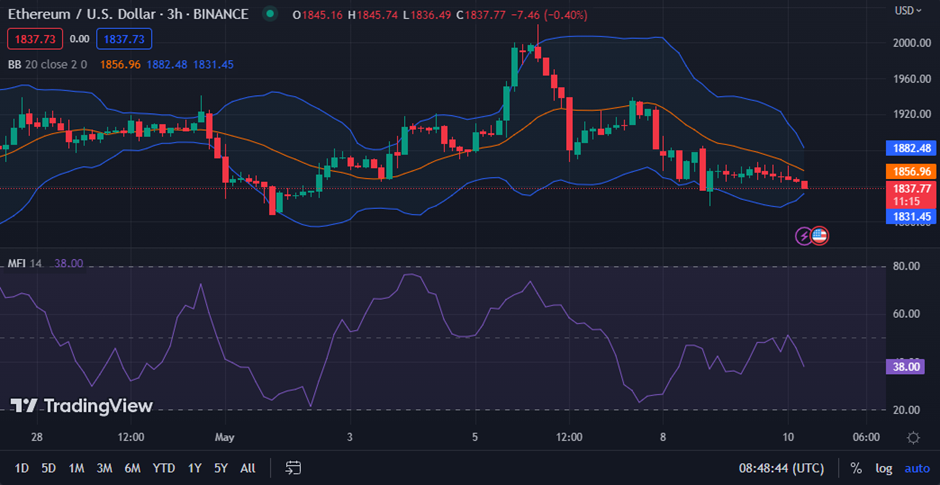
Bollinger bands converge on the ETH price chart, reflecting the potential for an upcoming significant price movement in the ETH market. The convergence of the Bollinger Bands indicates that the market is experiencing low volatility, which often precedes a surge in price action. Evidencing this move, the upper band reaches $1882.43, and the lower band touches $1831.51.
The Money Flow Index rating of 38.08 indicates that the negative trend in the ETH market is gaining strength. This MFI level illustrates the intensity of the market’s selling pressure, showing that the bears have taken control of the ETH market.
Consequently, traders must exercise care and use suitable risk management strategies to protect their holdings from further decline.
In conclusion, while ETH’s recent bearish trend presents risks, the platform’s potential for staking rewards and smart contract adoption could drive bullish sentiment and fuel demand.
Disclaimer: The views, opinions, and information shared in this price prediction are published in good faith. Readers must do their research and due diligence. Any action taken by the reader is strictly at their own risk. Coin Edition and its affiliates will not be liable for direct or indirect damage or loss.
Disclaimer: The information presented in this article is for informational and educational purposes only. The article does not constitute financial advice or advice of any kind. Coin Edition is not responsible for any losses incurred as a result of the utilization of content, products, or services mentioned. Readers are advised to exercise caution before taking any action related to the company.


 Price Prediction 2026, 2027, 2028, 2029, 2030-2050")
