


- LUNC sees over a 7% increase in price amid the bull run.
- Breaking the $0.0001 psychological barrier may catapult LUNC to new heights.
- MACD line suggests the tide is turning in favour of LUNC buyers.
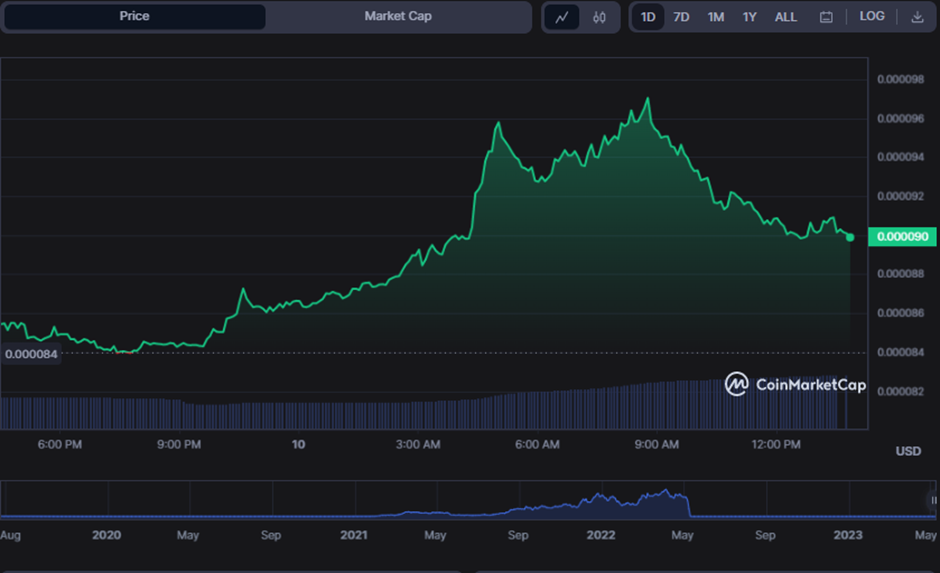
Since the start of trading, the bulls in the Terra Classic (LUNC) have successfully skyrocketed prices from an intra-day low of $0.00008374 to an intra-day high of $0.00009713. Despite the bull’s failure to break the 24-hour high, LUNC was trading at $0.00009007, a 7.12% increase, at press time.
If bullish momentum breaks over the 24-hour high of $0.00009713, the psychological barrier of $0.0001 will be the next milestone to monitor. Breaking over this level may draw additional buyers and catapult LUNC to new heights.
On the downside, if bears seize control and drive the price below the intraday low of $0.00008374, the next support level to watch is around $0.00008.
LUNC’s market capitalization and 24-hour trading volume increased by 7.05% and 74.12%, respectively, during the bull run, reaching $530,358,009 and $92,153,836.
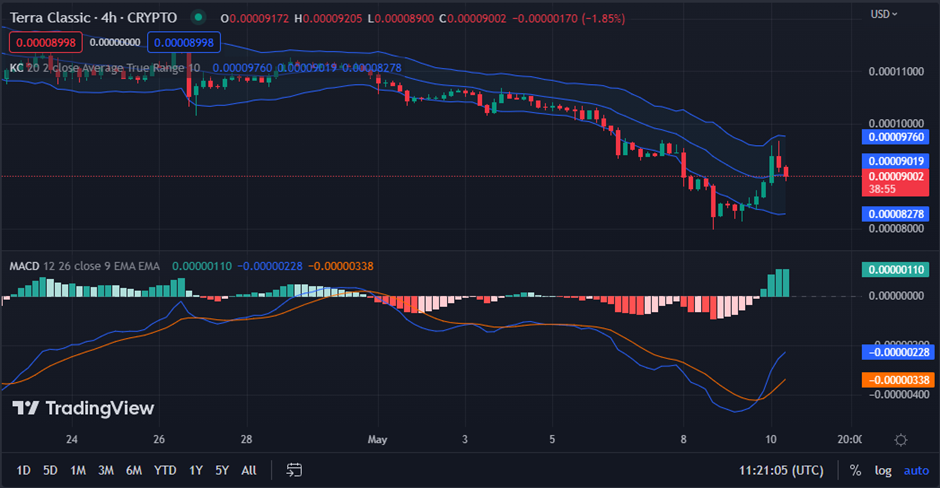
On the LUNC/USD price chart, the Keltner Channel bands are beginning to bulge, indicating that market volatility is increasing.
The current LUNC price movement, with its middle and lower bars, reaching $0.00009756, $0.00009012, and $0.00008271, indicates a rise in volatility. This indicates that the market is getting more busy, so traders may have more opportunities to benefit from price swings.
Another positive indication for LUNC is the MACD line crossing its signal line from below with a value of -0.00000231. This suggests that the tide is turning in favor of buyers and that there may be more upside potential soon. Furthermore, the development of green bars in the positive zone of the histogram suggests that buyers are gaining control of the market.
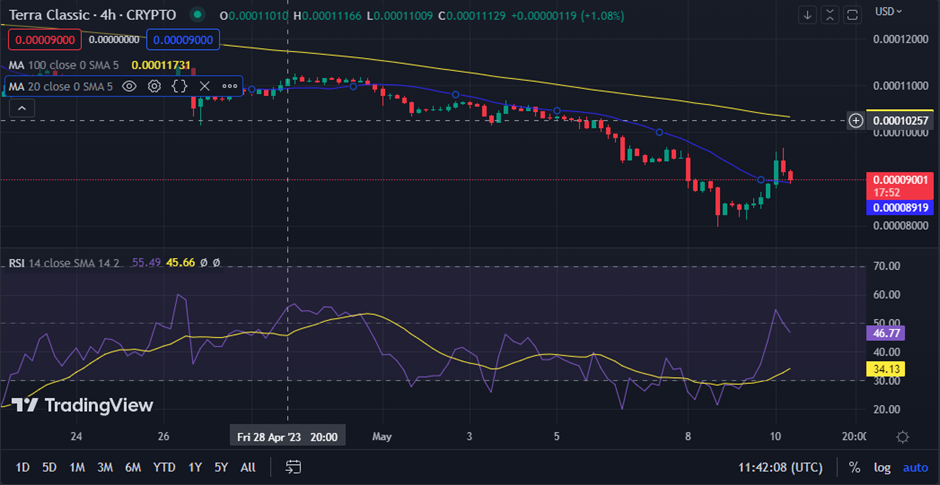
The 100-day moving average (yellow) rises above the 20-day moving average (blue), which reads 0.00008919, indicating that the bullish trend in LUNC is gaining strength.
This optimism stems from the rising longer-term trend, which might signal a change in momentum from pessimistic to optimistic.
With a Relative Strength Index of 46.33, there is still considerable selling pressure in the LUNC market. If the RSI rises over 50, the bullish momentum will acquire traction and attract additional buyers.
LUNC’s bullish momentum is gaining strength and may break the psychological barrier of $0.0001 and attract more buyers if bulls do not tire.
Disclaimer: The views, opinions, and information shared in this price prediction are published in good faith. Readers must do their research and due diligence. Any action taken by the reader is strictly at their own risk. Coin Edition and its affiliates will not be liable for direct or indirect damage or loss.
Disclaimer: The information presented in this article is for informational and educational purposes only. The article does not constitute financial advice or advice of any kind. Coin Edition is not responsible for any losses incurred as a result of the utilization of content, products, or services mentioned. Readers are advised to exercise caution before taking any action related to the company.
 Price Prediction 2026, 2027, 2028, 2029, 2030 -2050")


