


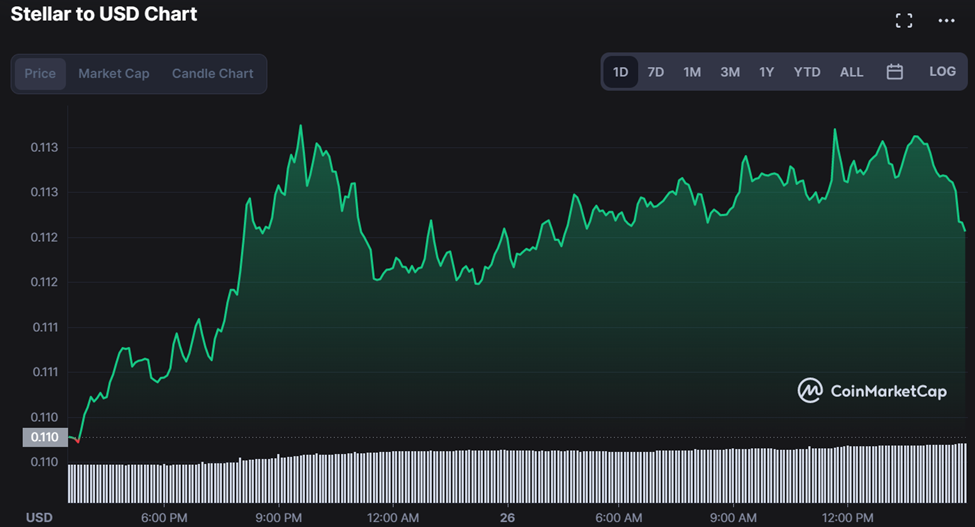
- XLM starts retracing after reaching an intraday high of $0.1132
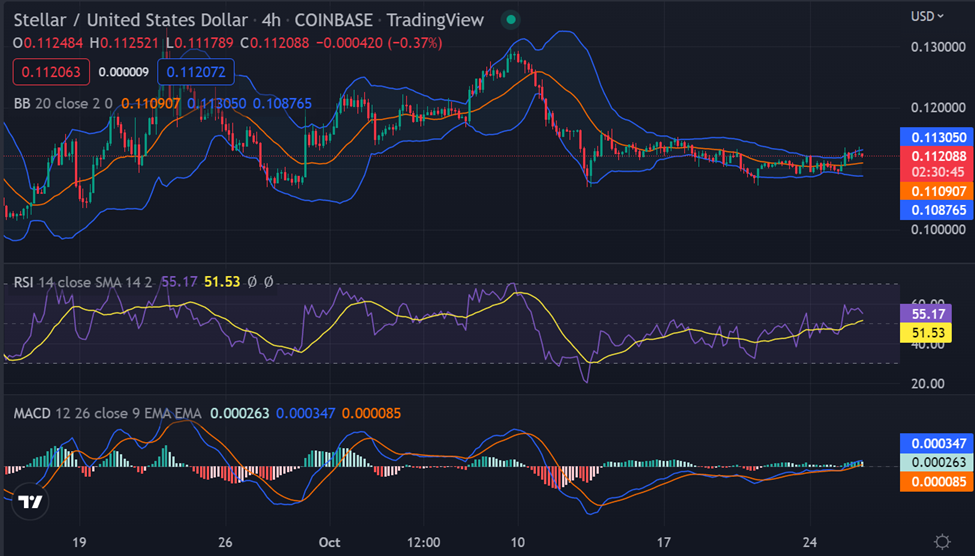
- Some bearish momentum is seen on the 4-hour chart, finding support at $0.1088
- XLM is currently testing the resistance at $0.1121
Recent Stellar price analysis shows XLM is currently losing steam after a period of strong bullish momentum. The altcoin reached an intraday high of $0.1132 but has since been met with bearish pressure and is currently testing support at $0.1088 on the 4-hour chart.
Despite this recent pullback, XLM remains in a good position to continue its bull run as it continues to consolidate around the $0.1121 level. However, it remains to be seen if the bulls will be able to regain control and push for higher highs. The altcoin is currently trading at $0.1121 with a trading volume of $119,068,190.04.
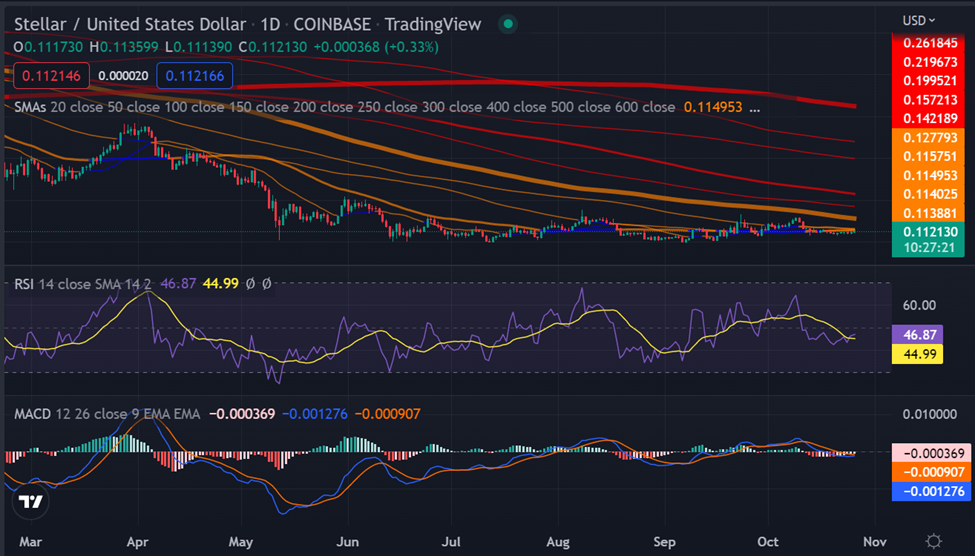
In terms of technical indicators on the daily chart, the Relative Strength Index (RSI) is currently hovering at a neutral 50. At the same time, the Moving Average Convergence Divergence (MACD) shows bearish momentum in the short term. The moving average lines are also starting to diverge, signaling a potential trend reversal.
The 50-day SMA used to measure long-term moving averages is located above the 200-day SMA, indicating that XLM is still in an overall uptrend, while the EMA Ribbon suggests the presence of strong support at $0.1050 and $0.1088.
Looking at the technical analysis on the 4-hour chart, XLM also faces resistance at $0.1136 and $0.1153.The Relative Strength Index indicator is pointing downwards, indicating bearish pressure on the altcoin. The lower band of the Bollinger bands is also providing support at $0.1088.The Bollinger bands are starting to close in, indicating increasing market volatility.
Overall, XLM is currently in a period of retracement after its recent bull run. However, with strong support levels and the potential for further bullish momentum shortly, all eyes will be on Stellar to see if it can continue its impressive price performance. However, with strong support levels and bullish technical indicators, XLM may still have room for growth in the long term. On the flip side, support levels can be found at $0.1107, $0.1088, and $0.1069. Moreover, traders may want to keep an eye on these key levels as XLM continues to consolidate in the short term.
Disclaimer: The information presented in this article is for informational and educational purposes only. The article does not constitute financial advice or advice of any kind. Coin Edition is not responsible for any losses incurred as a result of the utilization of content, products, or services mentioned. Readers are advised to exercise caution before taking any action related to the company.


