


- SUI price fluctuates in a tight range as bulls-eye $0.650 resistance.
- Rising trading volume hints at SUI market momentum.
- Caution is urged as SUI/USD indicators show signs of overbuying.
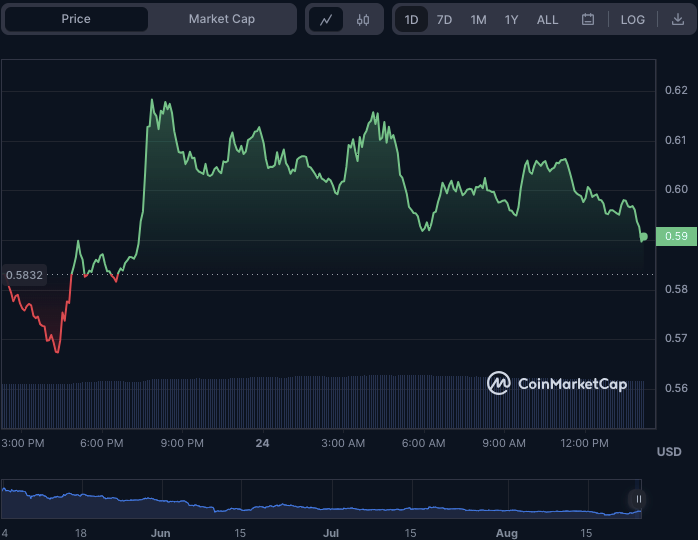
Despite early negative momentum that lowered the Sui (SUI) price to an intra-day low of $0.5673, bullish momentum took over and drove the SUI price to a high of $0.6185. At press time, the SUI price was $0.5907, indicating volatility as it continues to vary within a narrow range.
If bulls push beyond $0.6185, the next resistance level might be $0.6500. However, if the SUI price cannot push over the resistance level, a retracement to the $0.5700 support level is possible.
Sui’s market capitalization and 24-hour trading volume climbed by 2.86% and 7.15%, to $427,202,216 and $299,517,325, respectively, increasing investor interest and activity in the SUI market. This increase in trading volume shows that there may be an increasing number of buyers and sellers in the market, potentially leading to broader price swings and trading possibilities.
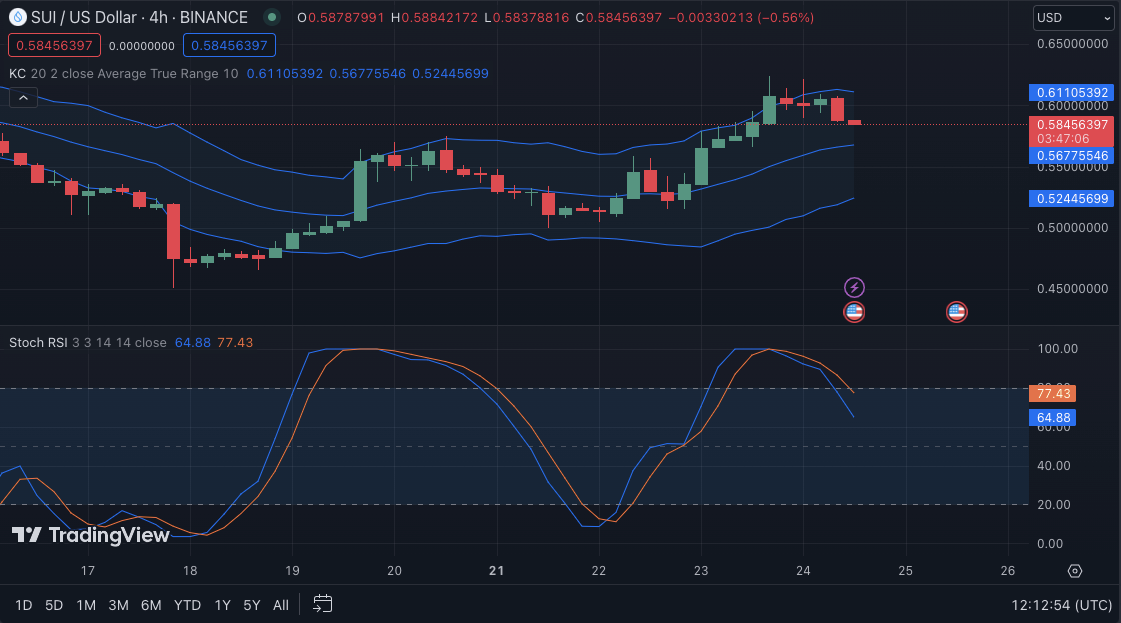
The stochastic RSI rating of 79.26 and downward movement indicate that SUI’s positive momentum may decrease in the near term. Adding to the bearish attitude, the stochastic RSI is going below its signal line and lower, indicating a likely trend reversal or a decrease in buying activity.
The Keltner Channel bands on the SUI/USD price chart are heading higher, with the upper, middle, and lower bands reaching $0.61307665, $0.56806060, and $0.52516861, respectively, implying that the SUI/USD price is now in an uptrend. However, the price movement has rebounded off the top band and generated red candlesticks, indicating that some selling pressure may enter the market.
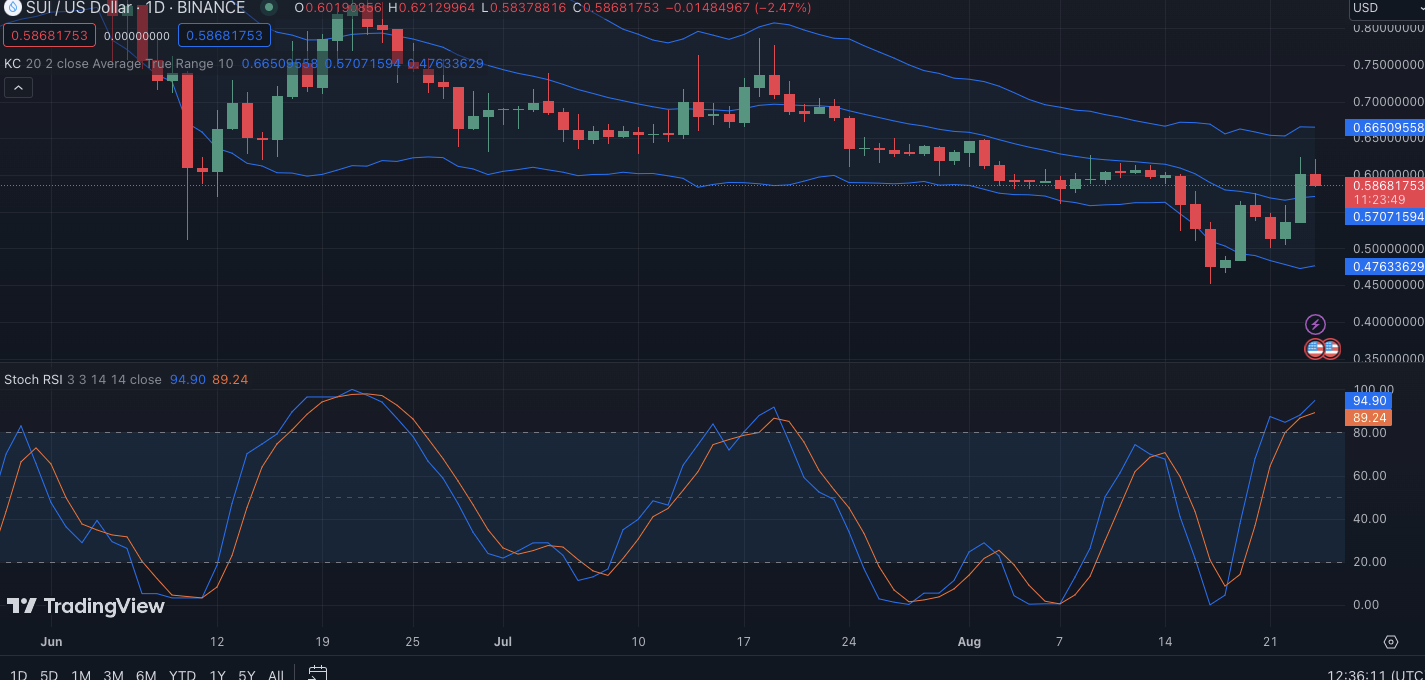
The Keltner Channel bands are touching at 0.66508712, 0.57076008, and 0.47638043 on the 24-hour price chart. This pattern suggests that the SUI/USD price has continuously risen over the last 24 hours. The top band shows possible resistance at 0.66508712, while the lower band implies potential support at 0.47638043.
The price action movement above the middle band indicates that the market is in an uptrend. However, the growing red candlestick on the chart suggests a probable reversal or correction since bullish momentum may be fading.
According to the stochastic RSI reading of 94.97, the SUI/USD market is overbought. This movement suggests that the bullish momentum is approaching its peak and that a possible reversal or correction is on the horizon. This level warns traders to be cautious and consider taking profits or using risk management methods to hedge against a possible SUI/USD market decline.
In conclusion, SUI’s price trend reflects volatility, with resistance at $0.6185. Overbought signals and Keltner patterns hint at caution ahead.
Disclaimer: The views, opinions, and information shared in this price prediction are published in good faith. Readers must do their research and due diligence. Any action taken by the reader is strictly at their own risk. Coin Edition and its affiliates will not be liable for direct or indirect damage or loss.
Disclaimer: The information presented in this article is for informational and educational purposes only. The article does not constitute financial advice or advice of any kind. Coin Edition is not responsible for any losses incurred as a result of the utilization of content, products, or services mentioned. Readers are advised to exercise caution before taking any action related to the company.


