


- TAIKO jumped 116% weekly, but major EMA resistance still threatens the recovery.
- Deeply negative funding hints at possible short squeeze and higher price volatility.
- Spot outflows show investors remain cautious despite the token’s strong rebound.
Taiko (TAIKO) has delivered one of the strongest recoveries in the cryptocurrency market this week, posting sharp gains over the past 24 hours and seven days. The token currently trades at $0.1388 after climbing 69.25% in a single day and more than 116% over the last week.
Daily trading volume has surged above $104.8 million, highlighting renewed investor interest. Despite the impressive rebound, technical indicators suggest buyers still face important resistance levels before confirming a broader trend reversal.
Technical Recovery Faces Important Test
The daily chart shows TAIKO rebounded strongly after forming a swing low around $0.0572. Buyers successfully pushed the token beyond the 50% Fibonacci retracement before profit-taking emerged near the 0.618 Fibonacci level. Even so, the price continues to trade above the 20-day exponential moving average at $0.1067, reflecting improving short-term momentum.
However, the recovery has reached a critical area. The 50-day EMA at $0.1344 continues to limit upside progress, while the 100-day EMA at $0.2079 and the 200-day EMA at $0.4259 confirm the broader trend remains bearish.
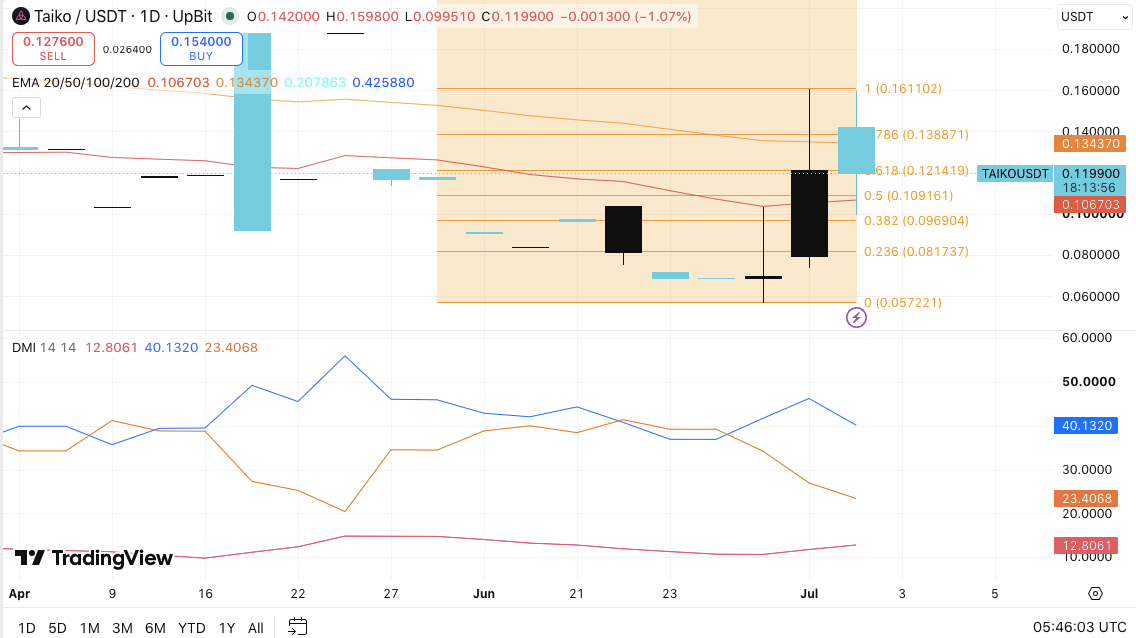
Additionally, the Directional Movement Index favors buyers, with the positive directional indicator standing above the negative indicator. Meanwhile, the Average Directional Index remains relatively low, suggesting the current trend still lacks strong momentum.
If buyers maintain control above the $0.1214 support level, TAIKO could retest resistance at $0.1344 before targeting $0.1389. A decisive breakout above that level would increase the likelihood of another move toward $0.1611. Conversely, a decline below $0.1092 could expose downside targets at $0.0969 and $0.0817 before fresh buying interest appears.
Funding Data Points to Potential Volatility
Derivatives data presents another important signal. The OI-weighted funding rate stayed mostly neutral throughout recent months, indicating balanced positioning between bullish and bearish traders. However, several temporary negative funding spikes appeared during late January, March, and early April.
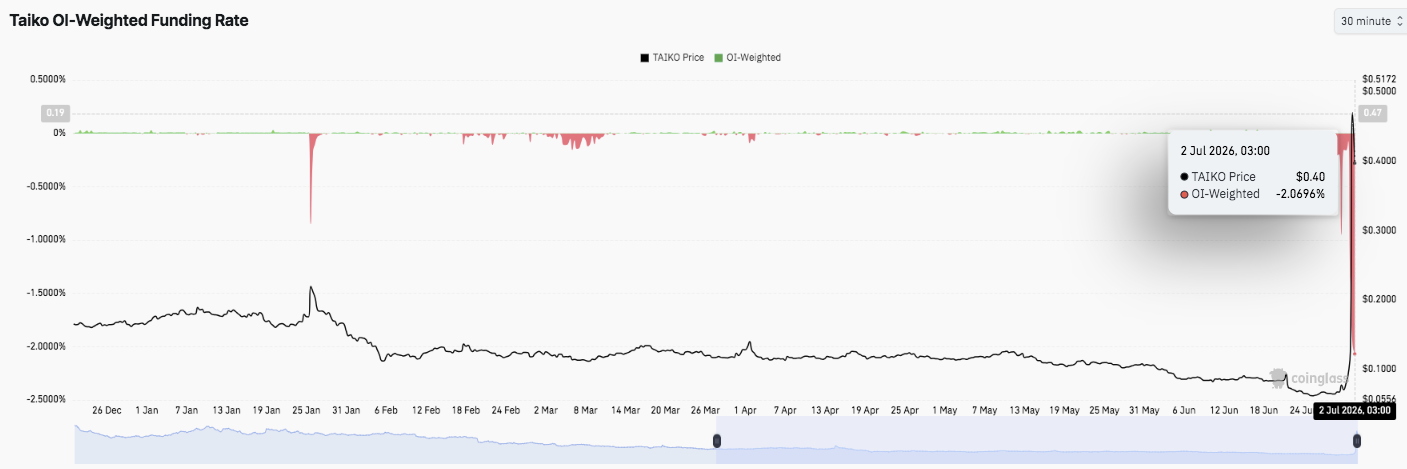
Significantly, the latest reading recorded a sharp drop to approximately -2.07% on July 2. This extreme negative funding rate emerged while TAIKO experienced a strong price rally. Such conditions often indicate an aggressive buildup of short positions, increasing the possibility of elevated volatility if bearish traders begin covering their positions.
Spot Flows Reflect Cautious Investor Sentiment
Spot market activity also highlights a mixed picture. Strong inflows between November and February briefly supported price stability, with net buying exceeding $450,000 during several sessions. However, those inflows failed to generate a lasting uptrend as repeated selling periods followed.
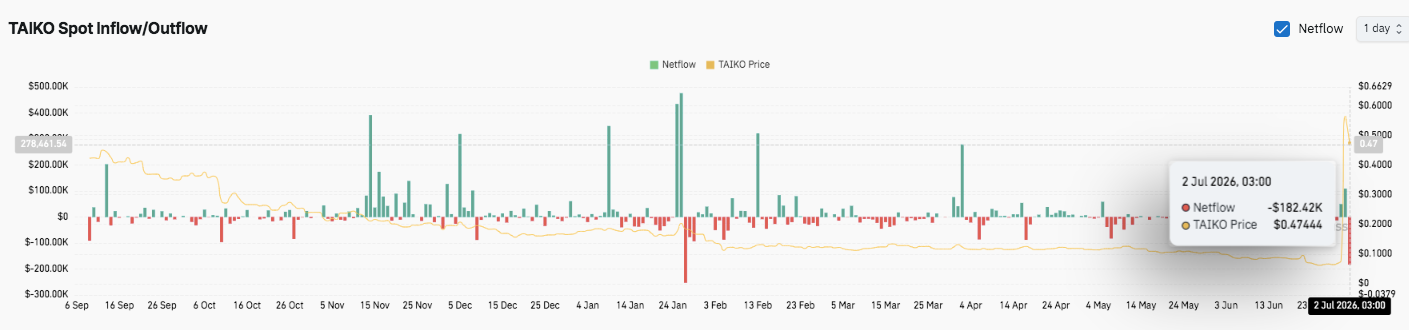
Moreover, market participation has weakened since March as both inflows and outflows declined. The latest data showed a net outflow of $182,420 on July 2, suggesting investors continue reducing exposure despite the recent rally. Consequently, sustained buying demand will likely determine whether TAIKO extends its recovery or returns to testing lower support levels.
Technical Outlook for Taiko (TAIKO) Price
Key levels remain in focus as TAIKO attempts to extend its breakout:
Upside levels: $0.1344 (50-day EMA), $0.1389 (78.6% Fibonacci retracement), and $0.1611 (major Fibonacci resistance). A sustained breakout above $0.1611 could open the door toward the psychological $0.2000 level.
Downside levels: $0.1214 (0.618 Fibonacci support), followed by $0.1092 (50% Fibonacci retracement), $0.0969 (38.2% Fibonacci), and $0.0817 (23.6% Fibonacci). The major swing low at $0.0572 remains the critical long-term support.
Resistance ceiling: The $0.1344–$0.1389 zone remains the immediate barrier. Clearing this area with strong volume would strengthen the case for a broader recovery, although the 100-day EMA at $0.2079 continues to define the medium-term bearish structure.
Will Taiko Go Up?
Taiko’s price outlook depends on whether buyers can maintain control above the $0.1214 and $0.1092 support region. Holding these levels would keep the recent bullish structure intact and allow another attempt to overcome the $0.1344–$0.1389 resistance cluster. A successful breakout could accelerate momentum toward $0.1611, with $0.2000 becoming the next upside objective.
However, derivatives and on-chain data suggest traders remain cautious. The recent spike in negative funding rates points to aggressive short positioning, creating conditions for elevated volatility and a potential short squeeze if buying pressure persists. At the same time, continued spot outflows indicate investor conviction has yet to fully recover.
If sellers push the price below $0.1092, TAIKO could retrace toward $0.0969 and $0.0817 before attracting renewed demand. For now, TAIKO remains at a decisive technical crossroads, with price action around current support likely to determine its next directional move.
Disclaimer: The information presented in this article is for informational and educational purposes only. The article does not constitute financial advice or advice of any kind. Coin Edition is not responsible for any losses incurred as a result of the utilization of content, products, or services mentioned. Readers are advised to exercise caution before taking any action related to the company.


