


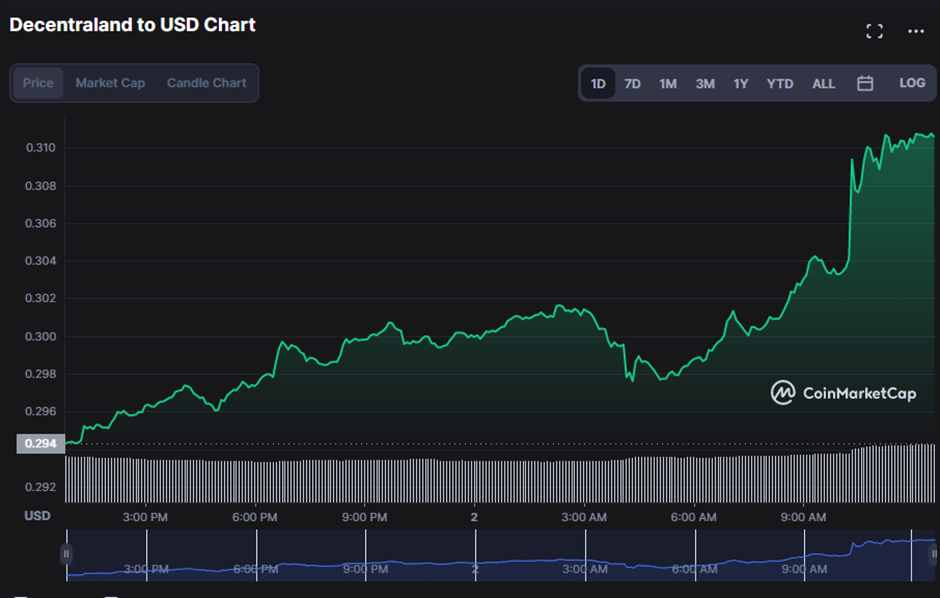
- MANA price analysis demonstrates a consistent rising trend.
- The support level for MANA is $0.2943, while the resistance level is $0.3108.
- Further bull domination might push the market over the resistance level.
Decentraland (MANA) entered the day with a positive valuation of $0.0294, suggesting that the start of the new year has been pleasant for the altcoin. The price of MANA has risen steadily throughout the day, up 5.44% to $0.3107 at the time of writing as the bulls continued to monopolize the market.
Market capitalization and 24-hour trading volume reflect market interest. Both have risen by 5.19% to $575,711,612 and 31.42% to $35,723,297, illustrating that interest in the MANA market is building, which may drive prices upwards.
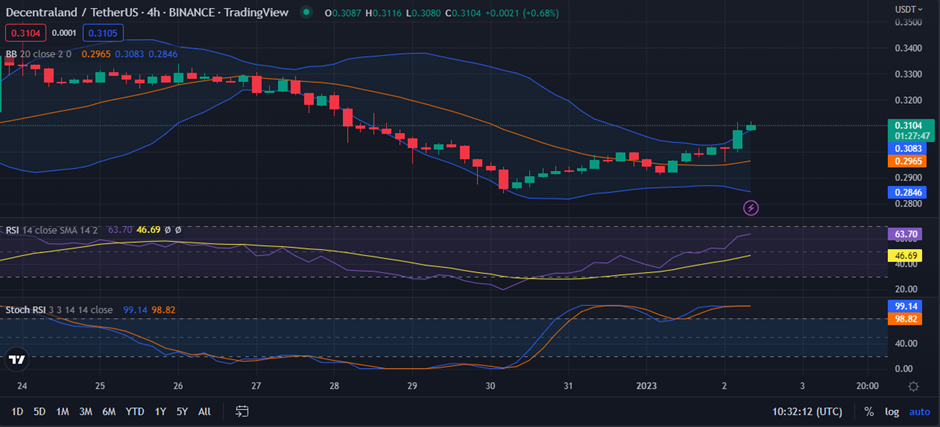
The 4-hour price chart’s widening Bollinger Bands indicate higher 24-hour trading activity, with the upper band nearing $0.3083 and the lower band at $0.2846. Amid rising market volatility, this shift lends credence to bullish forecasts. As the price remains above the top range, the bullish run is expected to continue since bullish strength is building.
This upward trend is bolstered by the relative strength index (RSI), which is heading higher, approaching the overbought area, with the current level of 63.50. Movement in this direction is indicative of increasing purchasing pressure, which in turn increases the likelihood of a price hike.
The stochastic RSI, on the other hand, warns traders that the bullish trend may be reaching its limit, since it is now in the overbought range at 99.14.
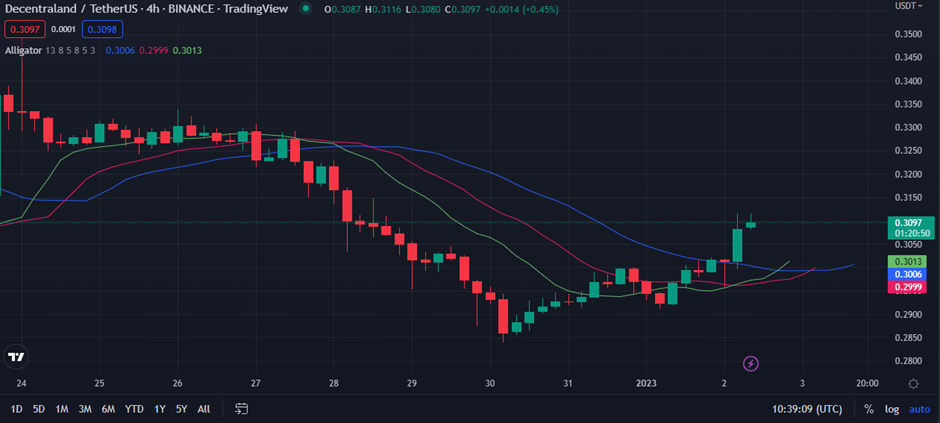
The gaping mouth of the Williams alligator implies that the bullish trend will continue. At 0.3013, 0.3006, and 0.2999, the green (lips), red (teeth), and blue (jaw) lines converge, respectively. Price rising over the alligator’s jaws, culminating in a bullish green candlestick, also denotes the continuance of MANA’s bullish ascend.
The market is expected to stay positive in general, with major technical indications pointing to more growth in the near future.
Disclaimer: The views and opinions, as well as all the information shared in this price prediction, are published in good faith. Readers must do their research and due diligence. Any action taken by the reader is strictly at their own risk. Coin Edition and its affiliates will not be held liable for any direct or indirect damage or loss.
Disclaimer: The information presented in this article is for informational and educational purposes only. The article does not constitute financial advice or advice of any kind. Coin Edition is not responsible for any losses incurred as a result of the utilization of content, products, or services mentioned. Readers are advised to exercise caution before taking any action related to the company.


