


- Ethereum (ETH) was able to print a gain over the past 24 hours.
- Sellers on ETH’s charts are attempting to defend the $1,833 resistance.
- Technicals suggest that ETH could drop to $1,788 if buyers don’t step in soon.
The altcoin market leader Ethereum (ETH) was able to print a 24-hour gain in the last 24 hours according to CoinMarketCap. As a result, the leading altcoin’s price stood at $1,827.30 at press time. Despite this recent gain, the crypto is still at risk of its price dropping in the next few days.
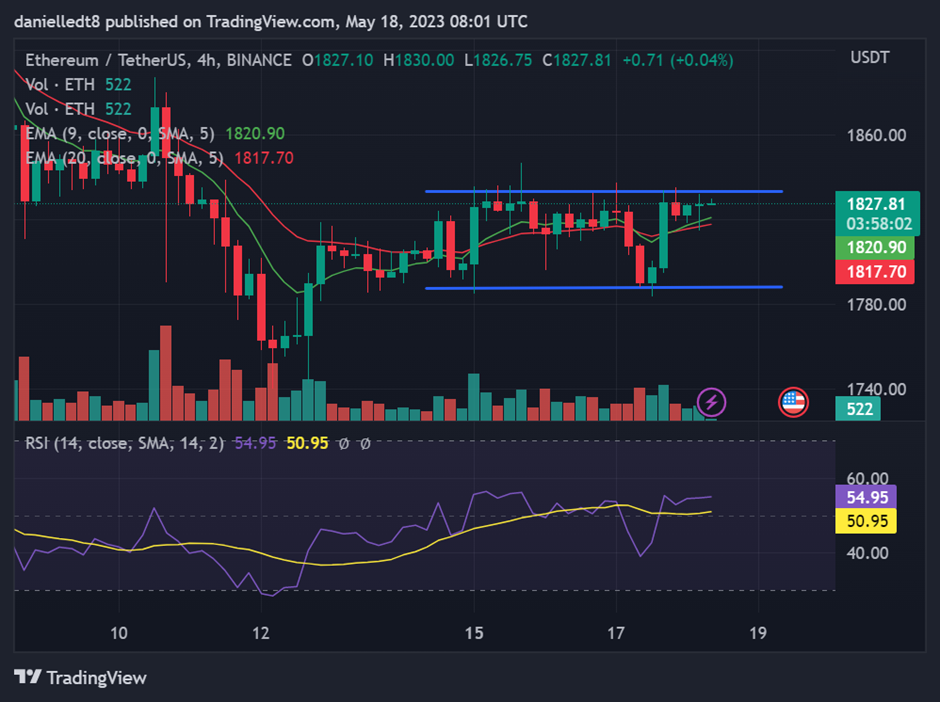
Looking at the 4-hour chart, ETH’s price was attempting to break above the key resistance level at $1,833. Bears, however, were exerting sell pressure in an attempt to defend the price point, which was evident by the wick present above the latest 4-hour candle.
Although ETH was trading bullishly above the 9 and 20 EMA lines on its 4-hour chart, it could still face the possibility of dropping below the two EMA lines in the next 24 hours. Should ETH’s price lose the support of the two EMAs, it will drop down to $1,788 in the following 24-48 hours.
A key indicator to watch is the 4-hour RSI line which was looking to cross bearishly below the RSI SMA line. If this cross happens, the bearish thesis will be validated. However, a break above the aforementioned $1,833 resistance in the next 24 hours will result in ETH climbing to $1,851 in the next 2 days.
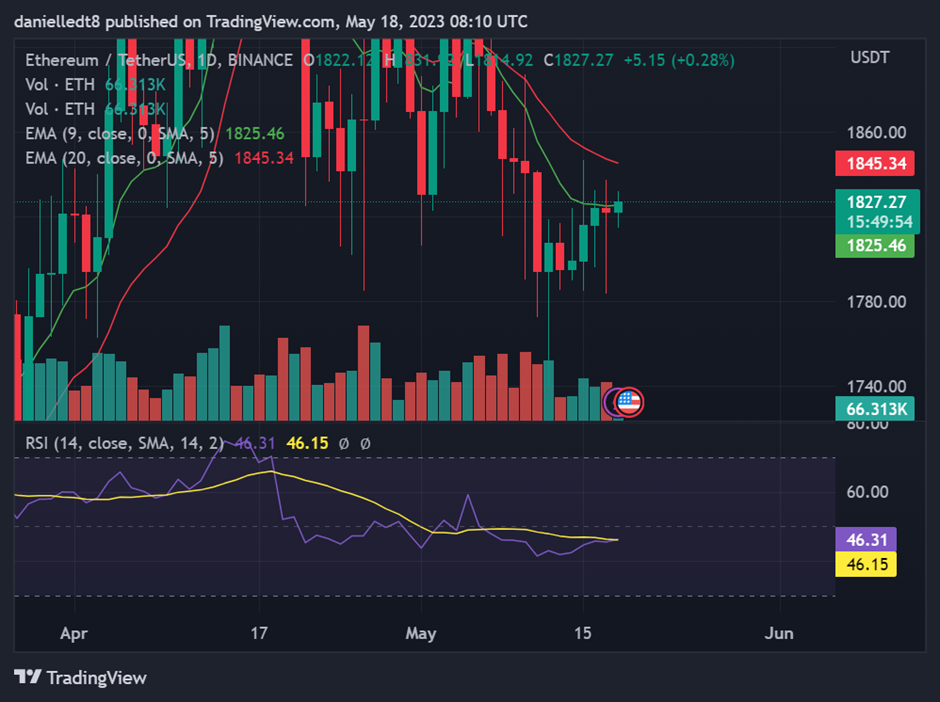
Meanwhile, the daily chart for ETH was contradicting the bearishness indicated on the 4-hour chart. At press time, the daily RSI line was looking to cross above the daily RSI SMA line, which would be a notable bullish flag. If this flag is validated in the next 24 hours, the crypto could see its price climb to $1,868 in the following 24-48 hours.
Given that the 4-hour chart is a more recent representation of ETH’s price movements, investors and traders may want to wait for ETH’s price to break above the $1,833 resistance before looking to enter into a long for ETH. For an extra confirmation, traders may also want to wait for ETH to close a daily candle above the 9-day EMA line.
Disclaimer: The views and opinions, as well as all the information shared in this price analysis, are published in good faith. Readers must do their own research and due diligence. Any action taken by the reader is strictly at their own risk. Coin Edition and its affiliates will not be held liable for any direct or indirect damage or loss.
Disclaimer: The information presented in this article is for informational and educational purposes only. The article does not constitute financial advice or advice of any kind. Coin Edition is not responsible for any losses incurred as a result of the utilization of content, products, or services mentioned. Readers are advised to exercise caution before taking any action related to the company.
 Price Prediction: Can BTW Sustain Its Breakout Above $0.1032?")


