


- At press time, DOGE was trading at $0.071 after its price dropped by 0.10%.
- A significant long-term bullish technical flag was on the verge of being triggered on the meme coin’s daily chart.
- Should the 20 and 50 EMA lines cross above the 100 EMA line in the coming week, DOGE could break above $0.08.
Heading into the new week, the total crypto market cap was able to climb by about 0.13%, which left it standing at $1.21 trillion, according to CoinMarketCap. Despite this, Dogecoin (DOGE) saw its price drop by about 0.10% over the past 24 hours of trading.
As a result, DOGE was worth $0.071 at press time. This meant that the meme coin was trading between its daily low of $0.06936 and its 24-hour high of $0.07275. Meanwhile, DOGE’s 24-hour trading volume decreased by more than 50% throughout the past day. This left its volume standing at $399.64 million.
DOGE’s latest price decline also caused it to weaken against both market leaders, Bitcoin (BTC) and Ethereum (ETH), by around 0.04% and 0.08% respectively. On the other hand, DOGE’s weekly performance was still firmly set in the green zone at +9.97%.
Its market cap of $9,956,558,761 meant that the meme coin was ranked as the 9th largest crypto. This placed it right behind Cardano (ADA) in the 8th position with its market cap of $11,110,196,731.
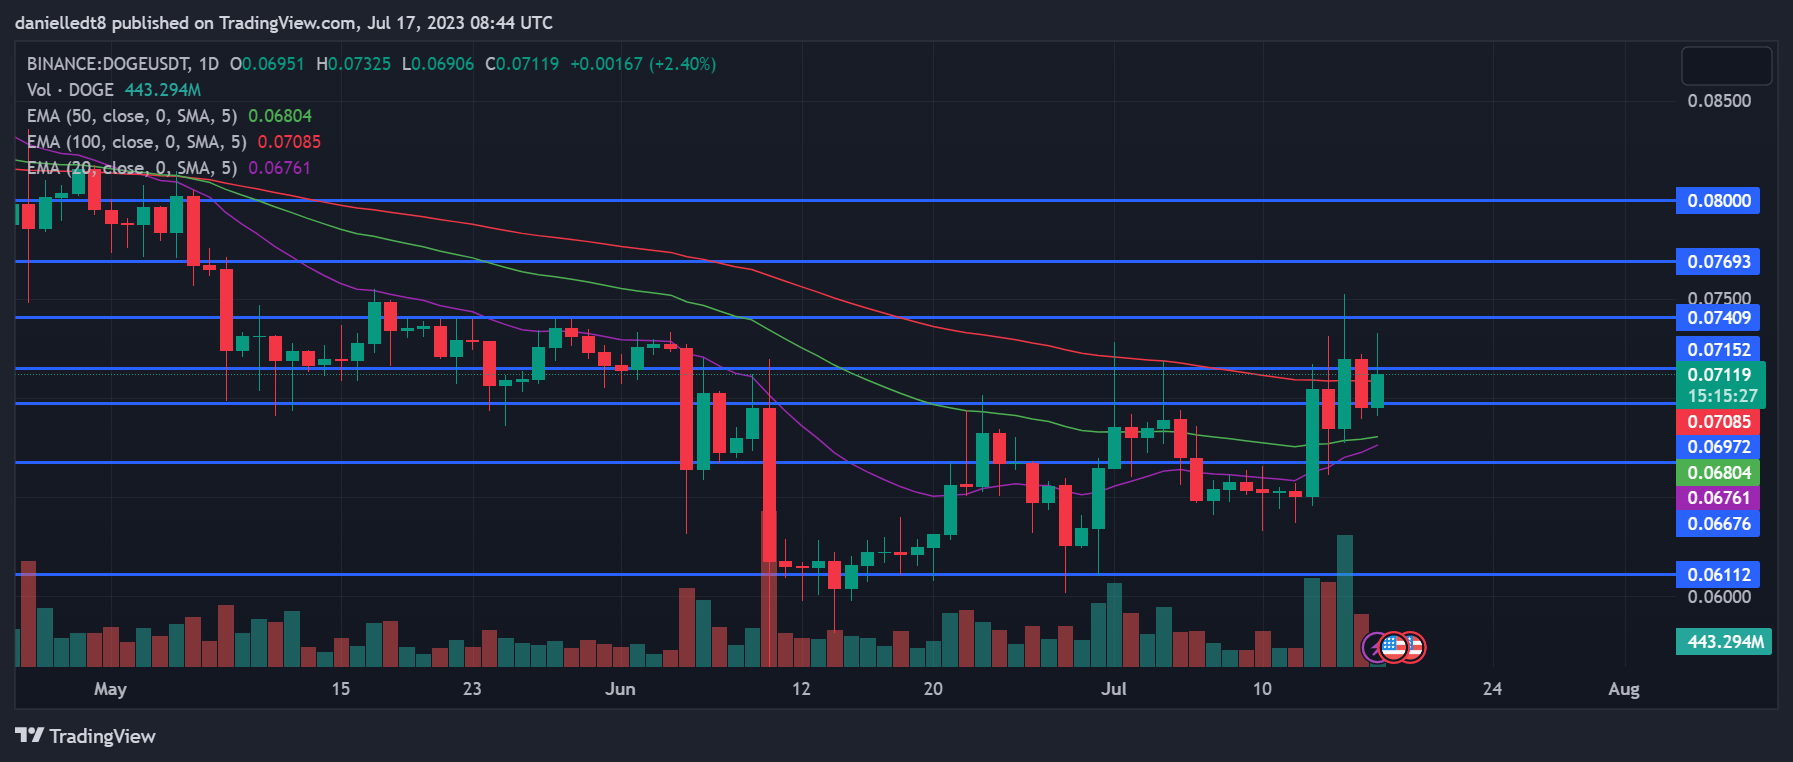
From a technical standpoint, DOGE was resting between the support level at $0.06972 and the resistance at $0.07152 at press time. It was able to break above this resistance level earlier today but has since retraced to its current level. Nevertheless, a significant long-term bullish technical flag was on the verge of being triggered.
At press time, the 20-day EMA line was closing in on the 50-day EMA line. Should these two technical indicators cross in the next few days, it will signal that DOGE’s price has entered into a long-term bullish cycle and its price may rise dramatically in the following weeks.
Should this happen, the meme coin’s price may break above the $0.07409 and $0.07693 resistance levels and potentially break above the major $0.08 mark as well. To try and gauge whether or not DOGE’s price will overcome the $0.8 resistance, investors and traders will want to keep an eye on the 20, 50, and 100 EMA lines on DOGE’s daily chart.
Should the 20 and 50 EMA lines cross above the 100 EMA line in the coming week, then DOGE may have the momentum needed to break above $0.08 and flip the level into support as well. A break above this significant mark could clear a path for DOGE to climb to above $0.1 in the next 2-3 weeks.
For this bullish thesis to be validated, DOGE will need to remain above the support at $0.06676 for the next week. If the altcoin’s price closes a daily candle below this support within the next 7 days, the bullish thesis will be invalidated and DOGE’s price may be at risk of falling to $0.06112 in the following week.
Disclaimer: The views and opinions, as well as all the information shared in this price analysis, are published in good faith. Readers must do their own research and due diligence. Any action taken by the reader is strictly at their own risk. Coin Edition and its affiliates will not be held liable for any direct or indirect damage or loss.
Disclaimer: The information presented in this article is for informational and educational purposes only. The article does not constitute financial advice or advice of any kind. Coin Edition is not responsible for any losses incurred as a result of the utilization of content, products, or services mentioned. Readers are advised to exercise caution before taking any action related to the company.


