


- MATIC printed a 24-hour loss of 1.55% to trade at $0.78 at press time.
- Meanwhile, ARB and LUNC saw their prices rise by 3.95% and 3.85% respectively.
- Technicals on the altcoins’ charts suggested that the cryptos may climb in the upcoming week.
The global crypto market cap rose 0.08% over the past 24 hours, according to the crypto market tracking website CoinMarketCap. This increase brought the total to approximately $1.21 trillion at press time. This positive momentum in the market may not be over, however, as multiple cryptos may rally in the coming week.
Specifically, Polygon (MATIC), Terra Classic (LUNC), and Arbitrum (ARB) displayed the most promise at press time as these altcoins were able to break above several technical indicators on their respective daily charts. Furthermore, technical indicators for these cryptos suggested that their prices could continue to rise in the coming 7 days.
Polygon (MATIC)
The price of MATIC dropped 1.55% over the past 24 hours. As a result, the Layer-2 crypto’s price stood at $0.78 at press time. Furthermore, MATIC also weakened against the two market leaders Bitcoin (BTC) and Ethereum (ETH) by 1.57% and 1.63% respectively.
The altcoin was able to reach a daily high of $0.7954 but has since retraced . As a result, MATIC was trading slightly closer to its 24-hour low of $0.7645. The daily trading volume for the crypto did, however, print a 12.39% increase over the past day of trading. This took the total volume to $312,008,198.
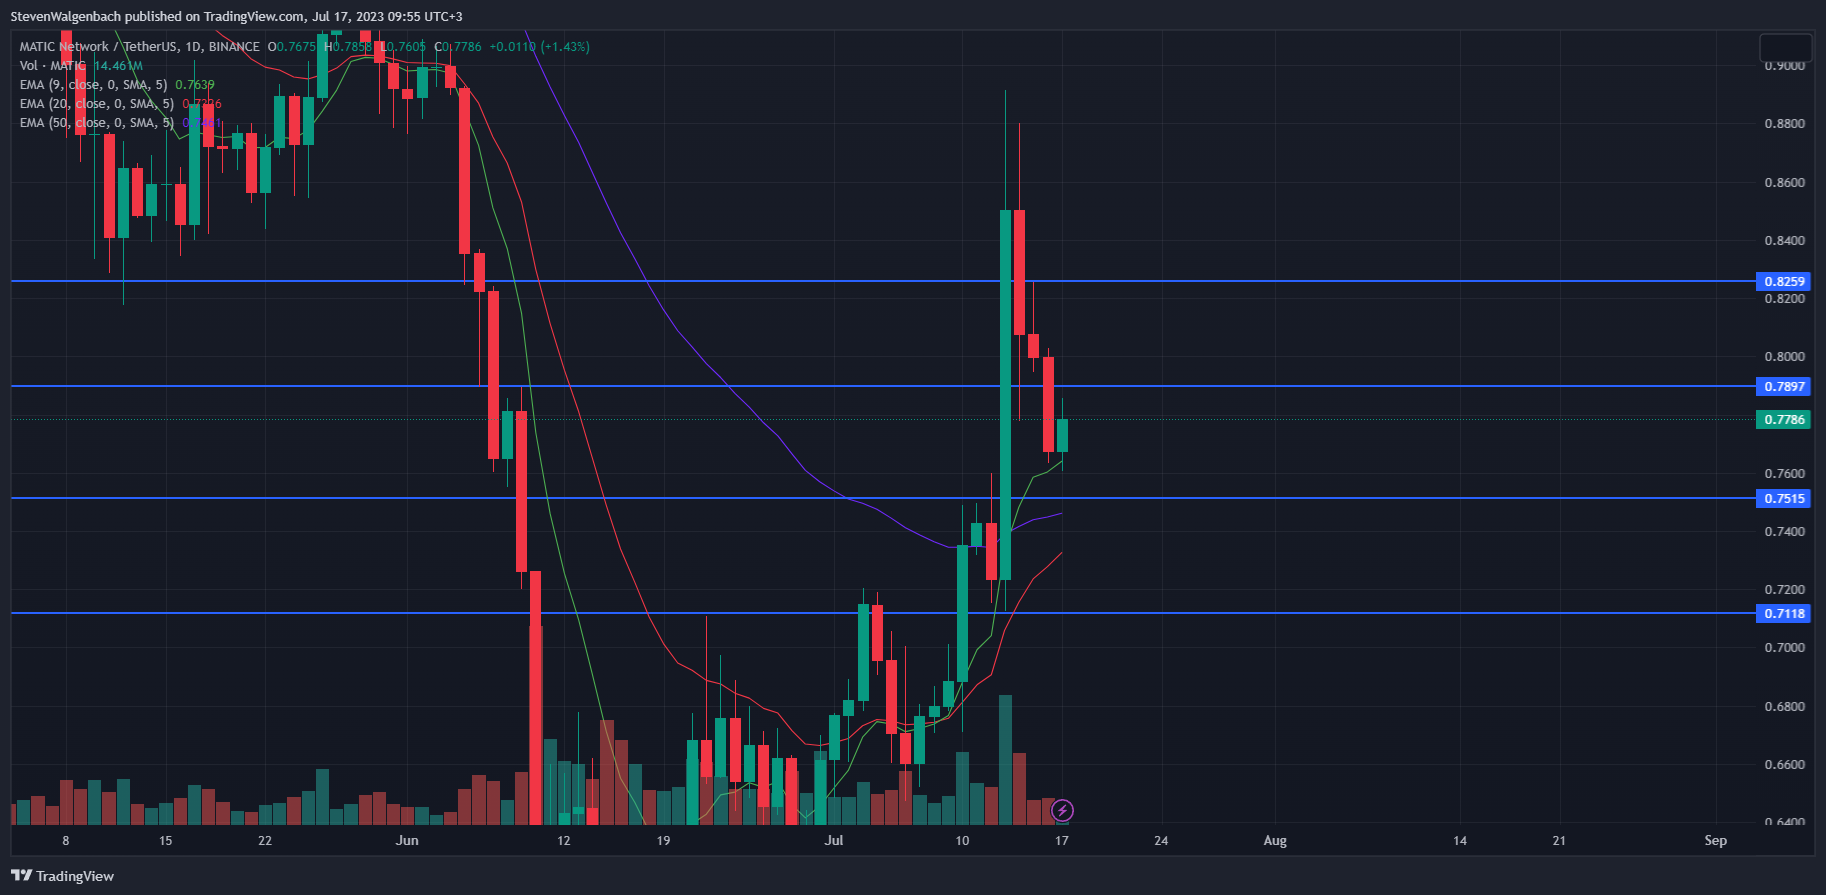
From a technical perspective, MATIC may be poised for a strong bullish breakout given the fact that the 9-day EMA line crossed bullishly above the 50-day EMA line last Thursday. This could signal that the altcoin may enter into a medium-term bullish trend soon. Investors and traders will want to keep an eye on the 20-day EMA line for the coming few days.
The 20-day EMA was closing in on the aforementioned 50-day EMA line as well. Should these two technical indicators cross it will indicate that the crypto’s price has entered into a medium-term bullish cycle.
If this bullish technical flag is validated, MATIC may look to overcome the next resistance level at $0.7897 in the following week. A break above this price point may clear a path for MATIC to climb to $0.8259 as well.
On the other hand, the price of MATIC closing today’s daily candle below the 9-day EMA line at approximately $0.7644 may invalidate the bullish thesis. In this scenario, the altcoin’s price may retest the support level at $0.7515 within the following 48 hours. Continued sell pressure could push the crypto’s price below this support level towards the next at $0.7118.
Terra Classic (LUNC)
LUNC printed a 24-hour gain of 3.95% and was trading at $0.00009301 at press time as a result of the daily increase. Not only did it gain against the Dollar, but it also strengthened against BTC and ETH by 4% and 3.97% respectively. This meant that 1 LUNC was worth 0.000000003071 BTC and 0.00000004814 ETH.
LUNC had slipped slightly after it established a daily high of $0.00009378 to trade at its current level. Nevertheless, the altcoin’s price remained closer to its daily high than its 24-hour low of $0.00008949 at press time.
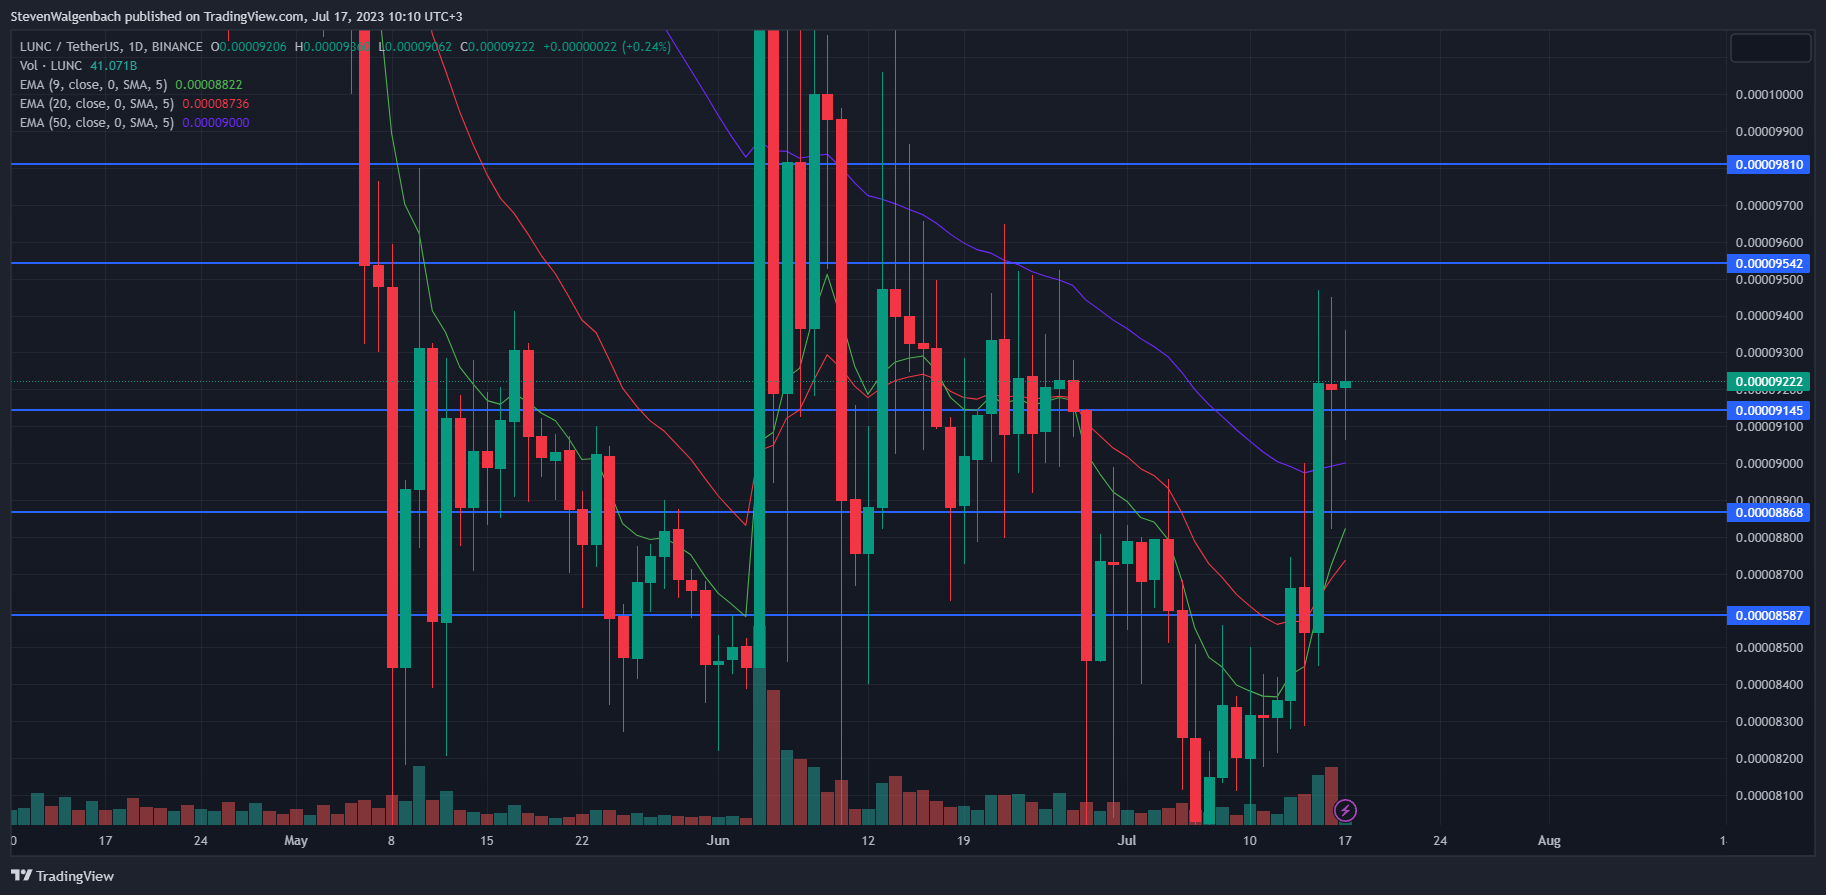
A bullish technical flag recently triggered on LUNC’s daily chart, as the 9 EMA line crossed above the 20 EMA line on Saturday. Since then, the altcoin’s price broke above the resistance levels at $0.00008868 and $0.00009145, where it continued to trade at press time.
LUNC had dropped below $0.00009145 earlier in today’s trading session, but bulls were able to boost the crypto’s price back above the key price point. If its price drops below this mark again during today’s trading session, then LUNC may be at risk of falling to $0.00008868 in the following 48 hours.
On the other hand, if the 9-day and 20-day EMA lines break above the 50-day EMA line at $0.00009005 in the coming few days, then LUNC may have the momentum needed to flip the $0.00009542 resistance into support. Continued buy pressure may even elevate the crypto’s price to above $0.00009810 in the following week.
Arbitrum (ARB)
ARB also saw its price rise over the past day of trading. At press time, the altcoin was changing hands at $1.32, which was a 24-hour gain of 3.85%. ARB’s 24-hour performance also outshined those of BTC and ETH, as the altcoin was up 4.14% against BTC and 4.02% against ETH.
The crypto was able to reach a daily high of $1.34 during the past day of trading, and was still trading fairly close to its daily high at press time. Meanwhile, the altcoin’s 24-hour low stood at $1.27.

Similar to LUNC, a bullish technical flag recently triggered on ARB’s daily chart. On Friday, the 20-day EMA line had crossed above the 50-day EMA line, which signaled that ARB was in a medium-term bullish trend.
In the days that followed this cross of the two technical indicators, ARB’s price had flipped the resistance levels at $1.2092 and $1.2714 into support. Furthermore, the crypto’s price was able to break above the significant resistance at $1.3180 earlier today, but had corrected to trade below the mark at press time.
If ARB closes today’s daily candle above $1.2714, then it may continue to rise in the upcoming 24-48 hours. Should this happen, ARB may attempt to flip the resistance at $1.3180 into support. However, a daily close below $1.2714 today may put the altcoin at risk of falling to $1.2092 in the coming few days.
Disclaimer: The views and opinions, as well as all the information shared in this price analysis, are published in good faith. Readers must do their own research and due diligence. Any action taken by the reader is strictly at their own risk. Coin Edition and its affiliates will not be held liable for any direct or indirect damage or loss.
Disclaimer: The information presented in this article is for informational and educational purposes only. The article does not constitute financial advice or advice of any kind. Coin Edition is not responsible for any losses incurred as a result of the utilization of content, products, or services mentioned. Readers are advised to exercise caution before taking any action related to the company.


