


- XTZ has increased gradually throughout the past week and reached its maximum price of $1.393.
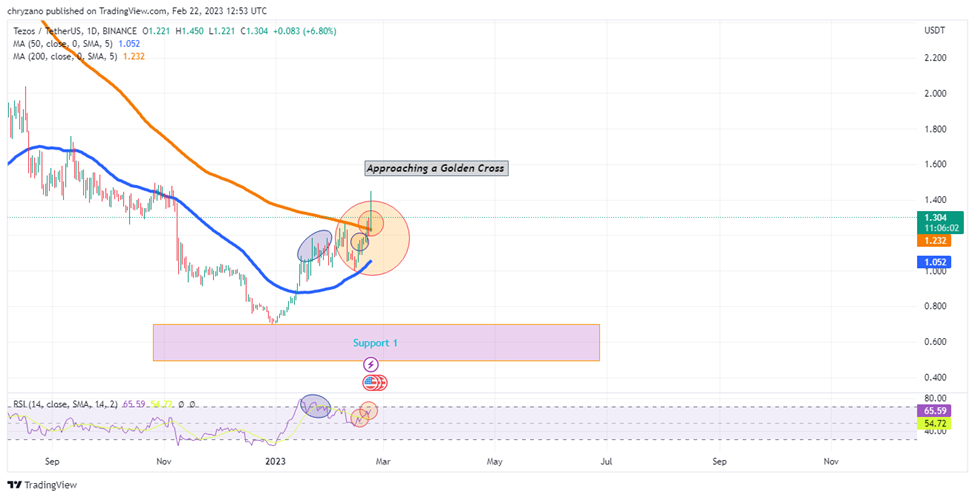
- The 50-day MA is approaching the 200-day MA. There could be a golden cross for XTZ.
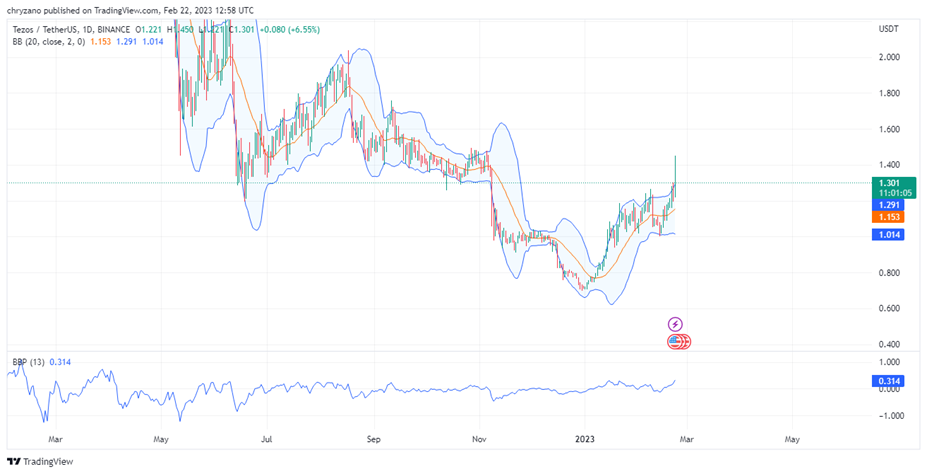
- Bollinger bands widen, and the bull’s power increases; XTZ could surge.
Tezos (XTZ) has been gradually rising throughout the week. The token was trading with an opening market price of $1.0776. For the first five days, the token was restricted to fluctuating within the $1.08 and $1.20 range. However, during the course of the fifth and sixth days, the token broke above the $1.20 resistance and reached the $1.30 limit.
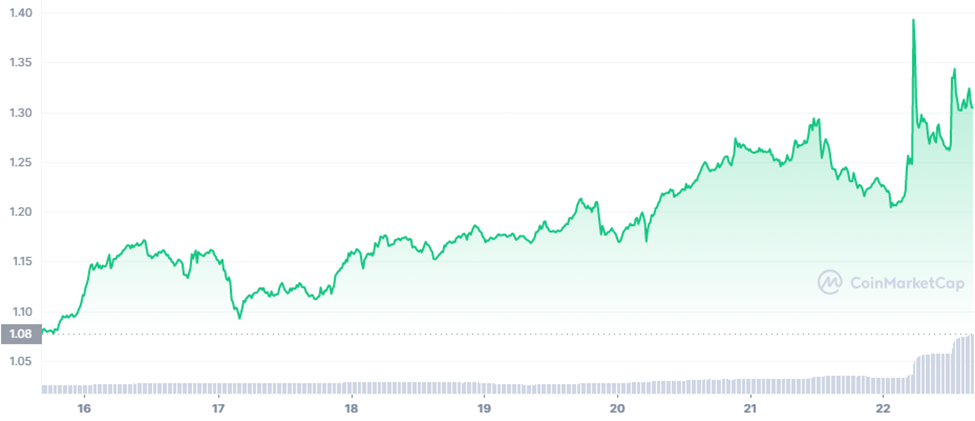
During the last hours of the sixth day, Tezos tanked from $1.2929 to $1.2061 within a few hours. On the seventh day of the week, the bulls pushed XTZ to its maximum price of $1.393. Currently, XTZ is up 5.79% in the last 24 hours and is trading at $1.31.
As shown in the daily chart below, XTZ is on the verge of forming the golden cross. The 50-day MA (blue) is approaching the 200-day MA (yellow) from below. As such, if the two lines are to intersect, the price of XTZ could drastically go up.
Moreover, when you scrutinize the RSI (blue elliptical) and the XTZ movements, it could be found that RSI was reaching lower highs when XTZ was reaching for higher-high. This indicated a bearish divergence. However, after dipping in prices, XTZ is now forming higher highs along with the RSI (small circles). This means that a bullish trend is well set. However, the RSI is at 65.48 and is heading into the overbought region. If the token reaches the overbought region, the market could correct the prices.
Additionally, the chart below shows that the Bollinger bands are widening, hence there could be more volatility in the market. Moreover, the Bull-Bear-Power is at 0.314 and is tilting more towards the positive direction (northward); thus, the bulls could dominate in the future.
It is not just the indicators that denote a positive sentiment for XTZ. In particular, The Luzern Lions (“Lions”), an American football team from the Swiss city of Lucerne, is creating its own coin. The Lions-Coin is not a speculative token but a stablecoin pegged to the Swiss Franc is secured by the Tezos blockchain technology. As such, it will be interesting to see how XTZ’s price will react to these.
Disclaimer: The views and opinions, as well as all the information shared in this price analysis, are published in good faith. Readers must do their own research and due diligence. Any action taken by the reader is strictly at their own risk, Coin Edition and its affiliates will not be held liable for any direct or indirect damage or loss.
Disclaimer: The information presented in this article is for informational and educational purposes only. The article does not constitute financial advice or advice of any kind. Coin Edition is not responsible for any losses incurred as a result of the utilization of content, products, or services mentioned. Readers are advised to exercise caution before taking any action related to the company.
 Price Prediction 2026, 2027, 2028, 2029, 2030-2050")
 Price Prediction 2026, 2027, 2028, 2029, 2030-2050")


