


- Tezos price declined by 1.52% in the past 24 hours.
- Bears have now fully taken charge of the XTZ market.
- Indicators forecast the decline might continue.
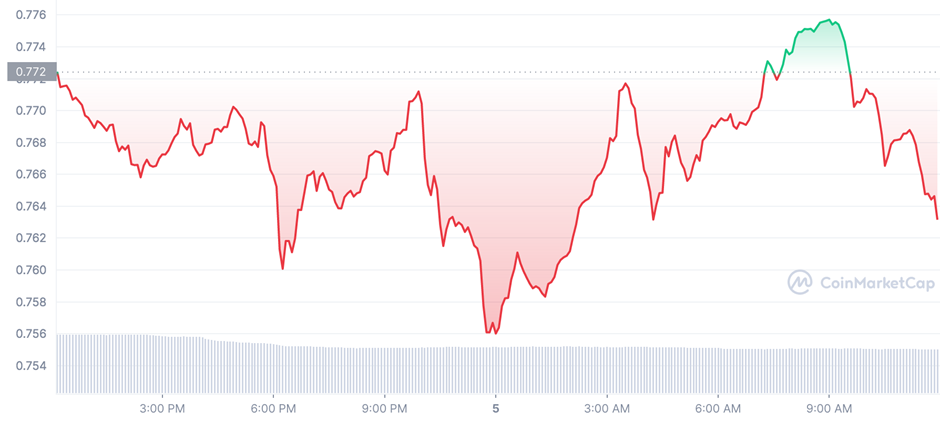
Following a bullish trend yesterday, the Internet Tezos market is once again under the hands of bearish, with prices falling by 1.52% to $0.7607. Since this bear market has continuously dominated the market, the bullish attempt at a reversal was deemed invalid after running into strong resistance at 0.773.
As a result of the bear grip, the market capitalization of the Tezos market decreased by 1.35% to $701,552,527. Selling pressure is seen to increase as traders leave the market out of concern of more price decreases as the 24-hour trading volume also drops by 25.64% to $14,849,708.
The lower band of the Bollinger bands has touched $0.7561 and the upper band has reached $0.7757, showing that market volatility is falling. When the price approaches the bottom of the band, indicating further depreciation, the negative trend is exacerbated.
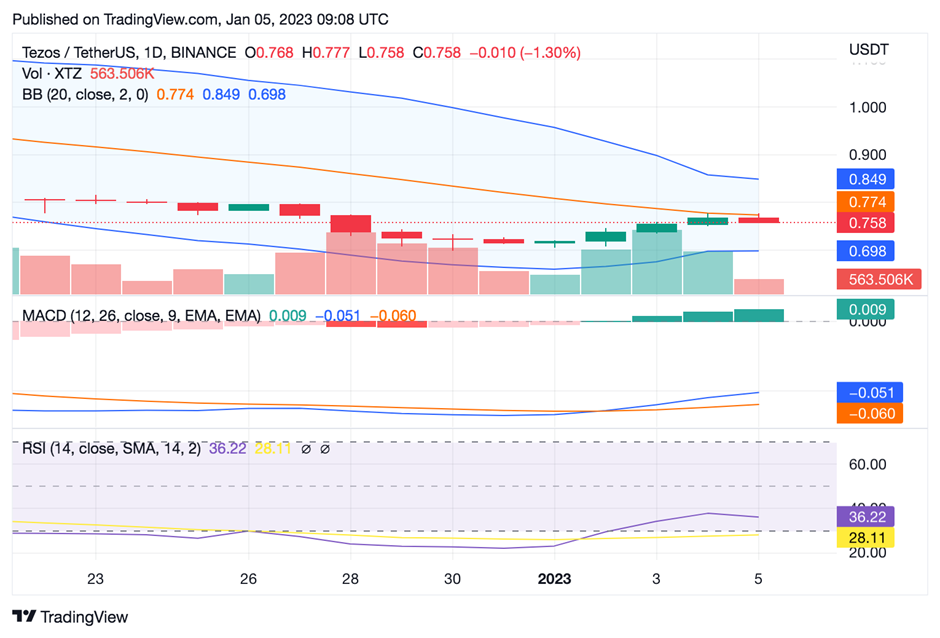
The RSI is at 36.32, a level of rising selling pressure, which suggests that investors have begun to lose interest in the coin. The RSI’s downward slant indicates that the bears’ momentum is increasing, which could portend the arrival of another downswing.
The blue line of the MACD remains above the signal line at -0.060, which is an encouraging point for XTZ market participants. Additionally, traders should be on the alert for a probable bearish trend in the near future given that the histogram is moving in the negative region.
Bulls are applying pressure to the XTZ market to reverse the negative trend as the shorter-term MA crosses above the longer-term MA. The XTZ market is ready for an upturn as the 20-day MA is at 0.75 and the 100-day MA is at 0.73.
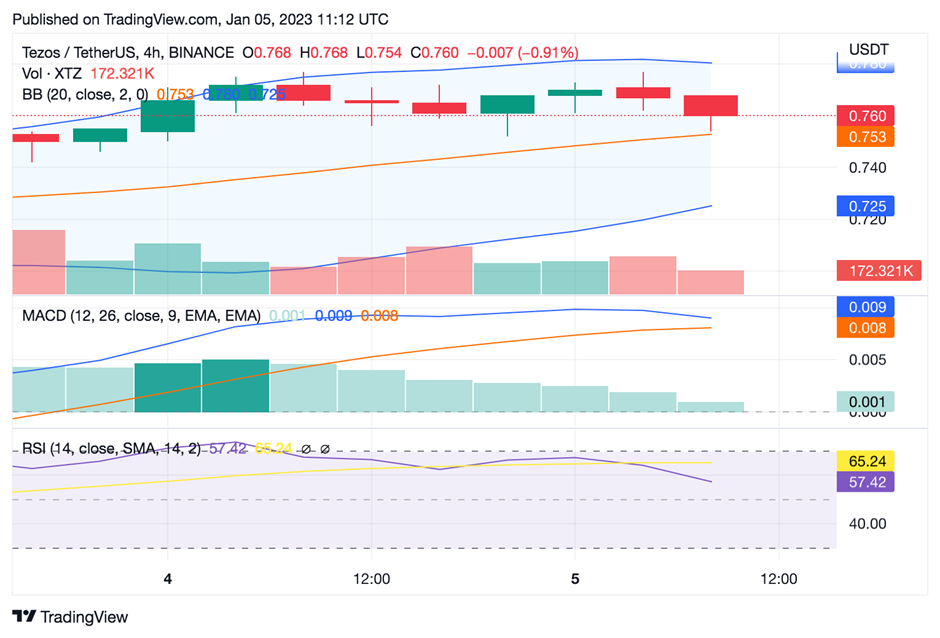
On a 4-hour chart, an analysis of the XTZ price reveals that it is still falling and has reached $0.760, as of this writing. The market has been under the influence of the bears for the previous few hours, and the short-term moving line has been sinking.
The value of the cryptocurrency has suffered during the past four hours, with a noticeable price decline. Tezos’s price is therefore more likely to experience a variable shift on either extreme as market volatility is rising in response to a movement.
Disclaimer: The views and opinions, as well as all the information shared in this price analysis, are published in good faith. Readers must do their own research and due diligence. Any action taken by the reader is strictly at their own risk, Coin Edition and its affiliates will not be held liable for any direct or indirect damage or loss.
Disclaimer: The information presented in this article is for informational and educational purposes only. The article does not constitute financial advice or advice of any kind. Coin Edition is not responsible for any losses incurred as a result of the utilization of content, products, or services mentioned. Readers are advised to exercise caution before taking any action related to the company.
 Price Prediction: Can BTW Sustain Its Breakout Above $0.1032?")


