


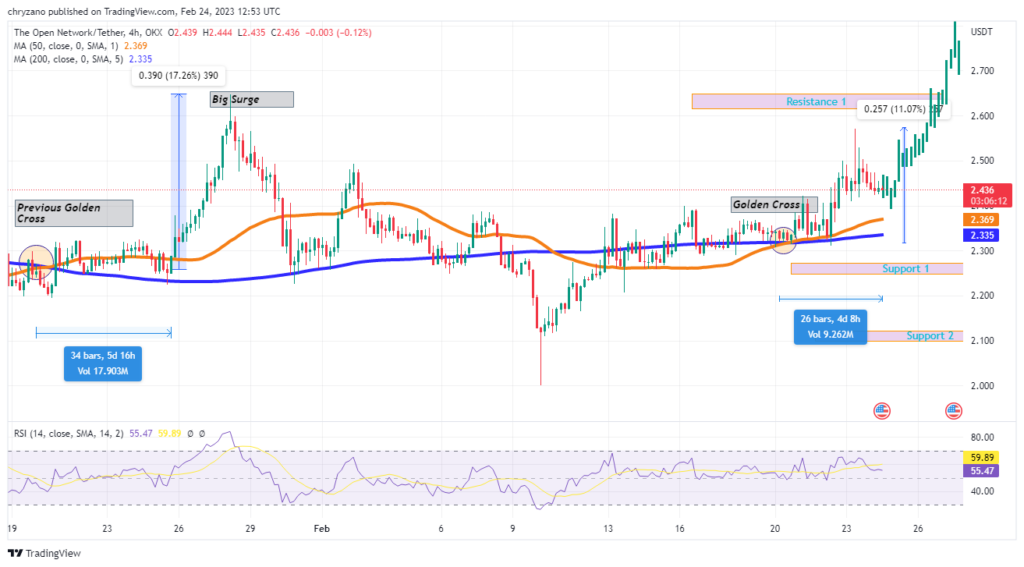
- TON emerges from the red zone and consolidates before the bulls drive its prices high.
- Previous Golden Cross produces a 17.26% increase in price, while the recent one brings only 11.07%.
- TON consolidated before the surge after the Golden Cross; there could be a surge as the token is consolidating.
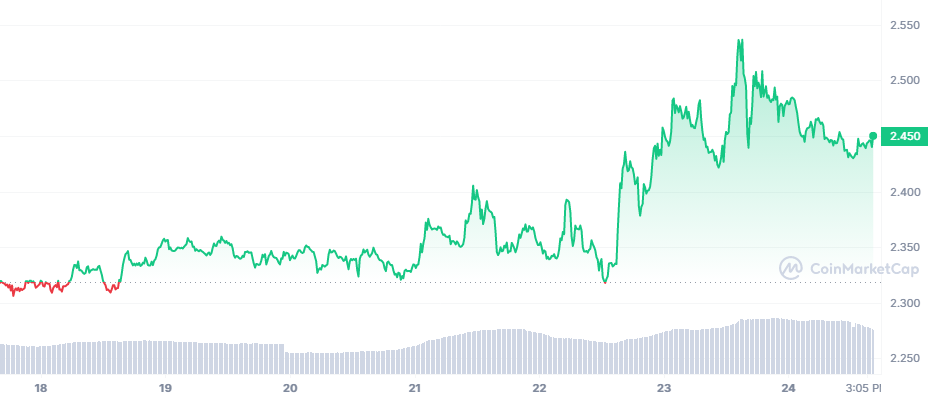
The past week for Toncoin (TON) has been quite successful. After a quick submerge into the red zone, TON was able to recover fast and reach the green zone. During its brief stay in the red zone, the token reached its lowest price of $2.3112 on the first. However, after heading over to the green zone, the token has been moving sideways.
TON’s movements were restricted between the $2.3 and $2.45 range for the first five days of the week. On the sixth day of the week, the bulls gave momentum to TON to set higher highs. During its rally, TON reached its maximum price of $2.5318. However, the bulls could not keep their pressure for a long time. Hence, TON came tumbling down. Currently, it is trading at $2.450, with a 43% increase in the last 24 hours.
we could find out that this Golden cross produced just an 11.07% surge while the previous intersection produced 17.26%.
Notably, TON had a brief period of consolidation after the Golden Cross but before the big surge, so is TON prepping for a surge?
Additionally, when considering the time frame, TON is almost nearing the time for the next big surge, which happens right after consolidating. If TON is going to spike, then it would go past Resistance 1.
However, the RSI Stochastic Indicator is 55.05, which indicates that the coin is in a strong trend, neither in the overbought nor in the oversold region. The RSI line has crossed below the signal line; hence, TON could plummet.
The above thesis could be supported with TON touching the upper Bollinger band; hence, the market could correct the prices. Additionally, the Bollinger bands are widening. As such, there could be more volatility on the horizon. If TON starts tanking, it could fall to Support 1, however, the 50-day MA could intersect the fall, as it has been strong support that has held TON many times.
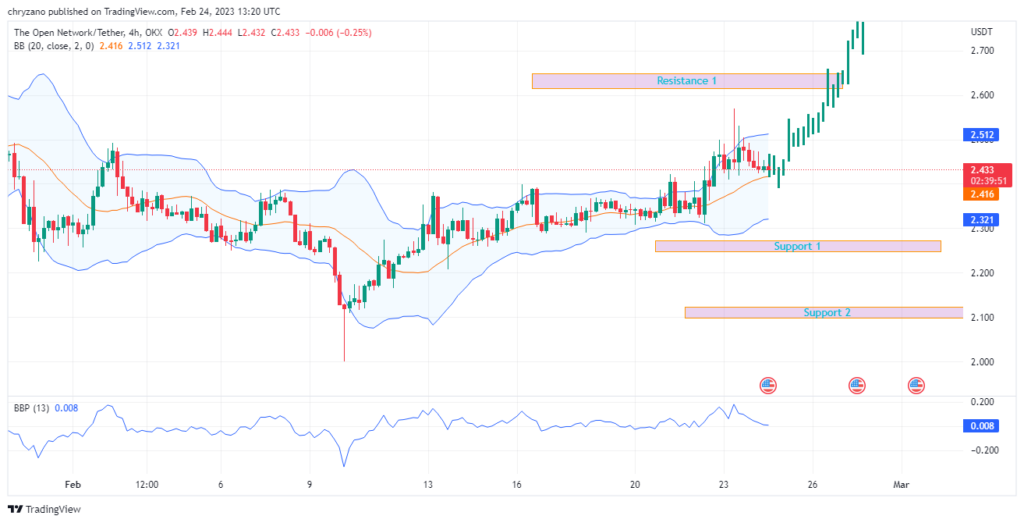
The Bull-Bear-Power (BBP) is at 0.008 and heading toward the zero line. This indicates that the bears are losing power. But the question is: is this the quiet before the tempest?
Will TON briefly decrease and spring up or will the bears drag TON deep into the mire?
Disclaimer: The views and opinions, as well as all the information shared in this price analysis, are published in good faith. Readers must do their own research and due diligence. Any action taken by the reader is strictly at their own risk, Coin Edition and its affiliates will not be held liable for any direct or indirect damage or loss.
Disclaimer: The information presented in this article is for informational and educational purposes only. The article does not constitute financial advice or advice of any kind. Coin Edition is not responsible for any losses incurred as a result of the utilization of content, products, or services mentioned. Readers are advised to exercise caution before taking any action related to the company.


