


Scaling solutions in the crypto ecosystem has become a dire need, especially for the Ethereum (ETH) blockchain. So, it was not surprising that many Ethereum Layer 2 (L2s) sprung up in the last few years.
For the unfamiliar, the main goal of scalability is to increase transaction throughput and speed without compromising on security or decentralization. Interestingly, almost all of the scaling solutions have tokens attached to them, and in 2024, some of these tokens might experience a breakout.
In this article, Coin Edition will focus on the top 10 Layer 2 tokens with immense potential in 2024. Here, you will also find out why the fundamentals behind the projects might play crucial roles in the performance of the native tokens.
Arbitrum (ARB)
Arbitrum (ARB) has cemented its place as one of the scaling solutions with the most traction. This is because it is one of the few projects using optimistic rollups to improve speed and cost-efficiency on Ethereum. However, the ARB token has had its share of troubles.
Between December 2 and 12, ARB’s price traded between $1.06 and $1.21. However, the 4-hour ARB/USD chart showed that all that may have been in the past. Previously, Coin Editon had reported how ARB was showing signs of a breakout.
On December 23, ARB broke out of its tight trading range as the price rose to $1.45. However, the price has decreased lately. The token dropped to $1.29 in the process.
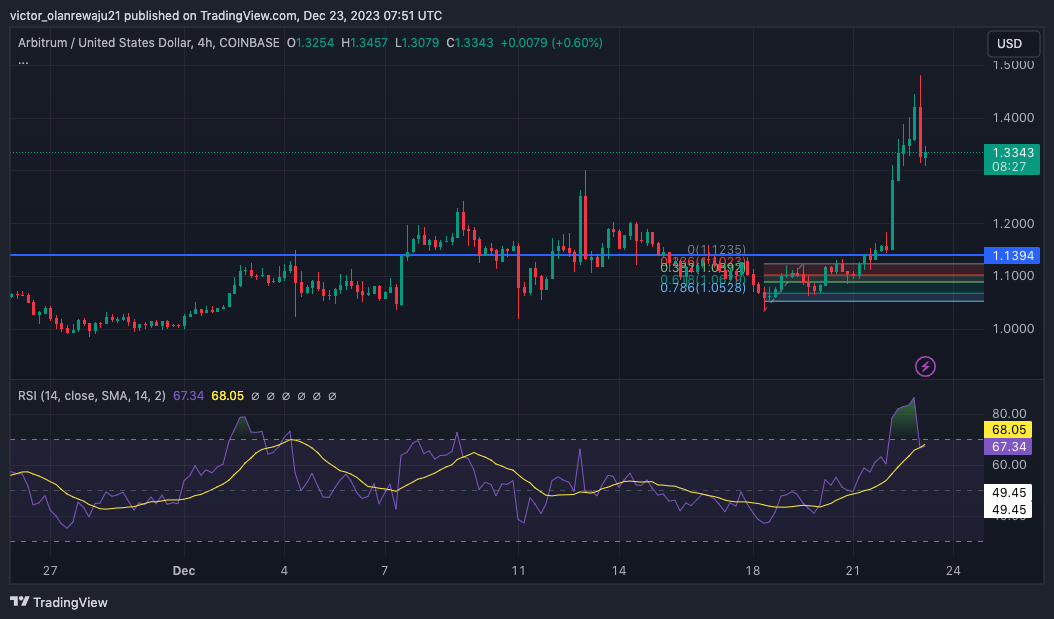
A look at the Relative Strength Index (RSI) showed that the indicator had decreased to 47.28. If profit-taking intensifies, the price may decrease to the $1.10 region. Should this happen, the RSI reading may drop below 30.00 and this could be a good entry point before the token approaches $2.
Polygon (MATIC)
Polygon (MATIC) uses a modular framework to scale the development of applications on Ethereum while enabling faster transactions. For MATIC, its price has increased by 109% in the last 90 days, CoinMarketCap revealed. This price increase impacted the Money Flow Index (MFI) to hit 91.08. The MFI swings between 0 and 100.
Reading above 80 indicates that a cryptocurrency is overbought. If the MFI falls below 20, it implies that a token is overbought. At press time, MATIC was trading at $1.06. But the MFI reading is an indication to sell.
Therefore, MATIC might decrease below $1 in the coming days. However, the 0.5 Auto Fibonacci extension showed that the price may drop to $0.90.
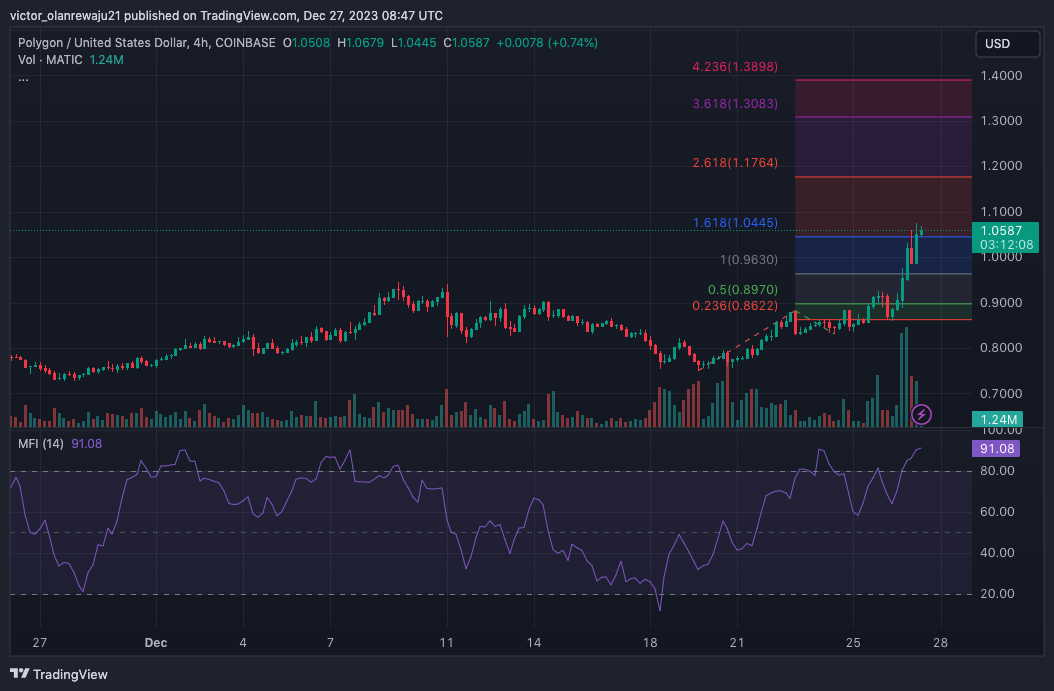
Also, the 4.236 Fib level indicated that the next area of interest might be $1.40. So, traders looking for long MATIC might need to look for entries around $0.90. So, traders looking for long MATIC might need to look for entries around $0.90 before the rally begins.
Immutable X (IMX)
Immutable X (IMX) is an L2 that allows the quick deployment of complex smart contracts and applications on Ethereum. In the last 365 days, IMX has increased by 473.21%, data from CoinMarketCap showed. However, the Awesome Oscillator (AO) showed that IMX momentum had become bearish. At press time, the AO was -0.04.
The AO reading below the zero line indicates an existing downtrend. The Bollinger Bands (BB) also revealed that the volatility around the cryptocurrency had become low. So, the IMX price may only fluctuate within a higher range in the short term.
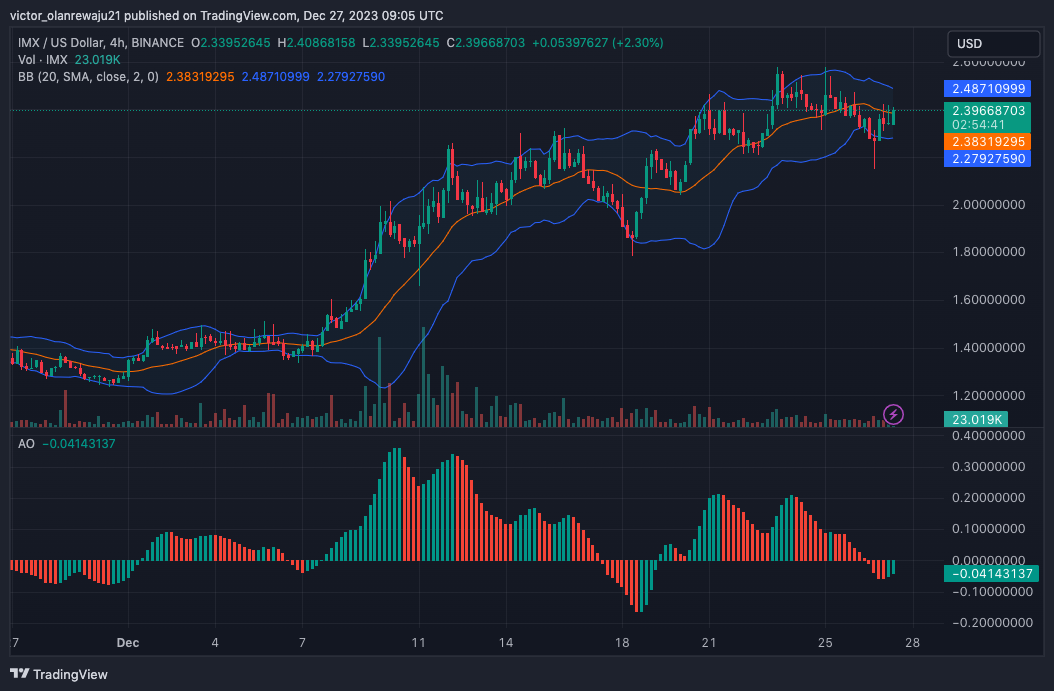
At the same time, the contracting bands could be the catalyst that foreshadows a breakout. Going forward, IMX may lean toward $3 as a full-blown altcoin season could be near.
Optimism (OP)
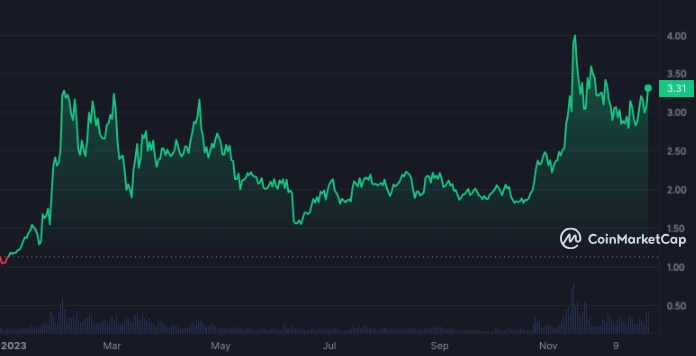
Optimism (OP) contributes to the Ethereum ecosystem by enabling trustless transactions using optimistic rollups like Arbitrum. OP’s price at press time was $3.30.
But the breakout already seemed to have begun since December 19, when the price was $2.13. The price action was also able to break the $2.34 resistance, leading to a rise above $3.
In the meantime, OP may decrease below $3.29. But there was strong support at $3.14. Should OP maintain the support, the price might rise close to $4. This inference was also confirmed by the Exponential Moving Average (EMA).
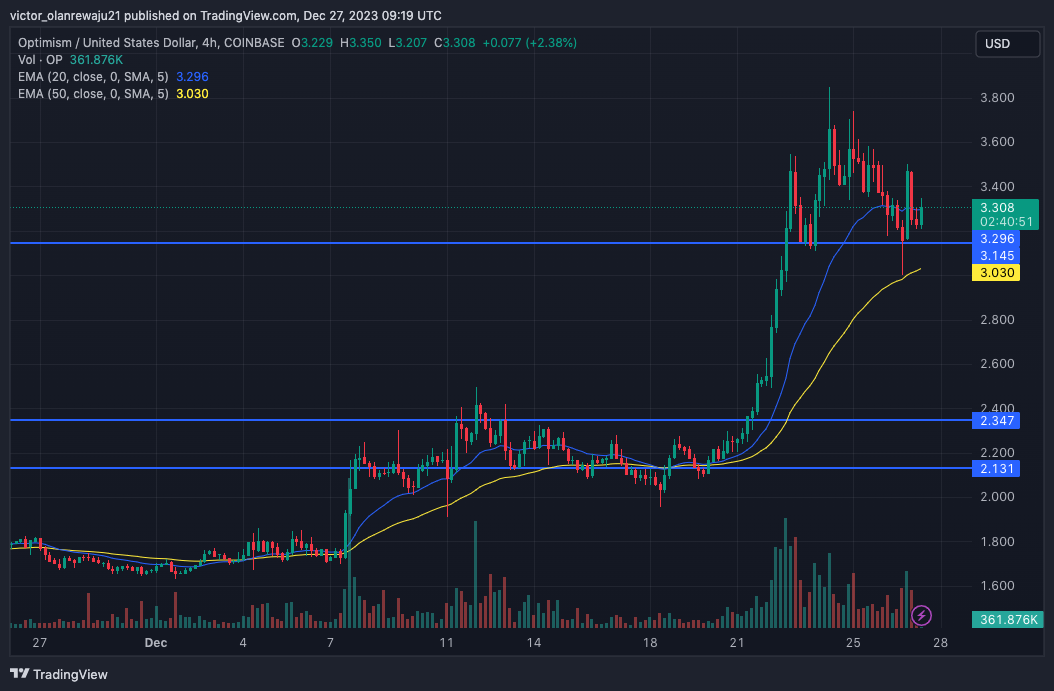
At press time, the 20 EMA (blue) had risen above the 50 EMA (yellow), suggesting a bullish bias for the token. If selling pressure does not outpace accumulation, then OP’s breakout may be something to look out for.
Mantle (MNT)
Mantle (MNT) enables scalability on Ethereum by compressing expensive gas fees in the form of a block. According to CoinMarketCap, MNT’s 30-day performance was lower compared to the likes of OP and ARB.
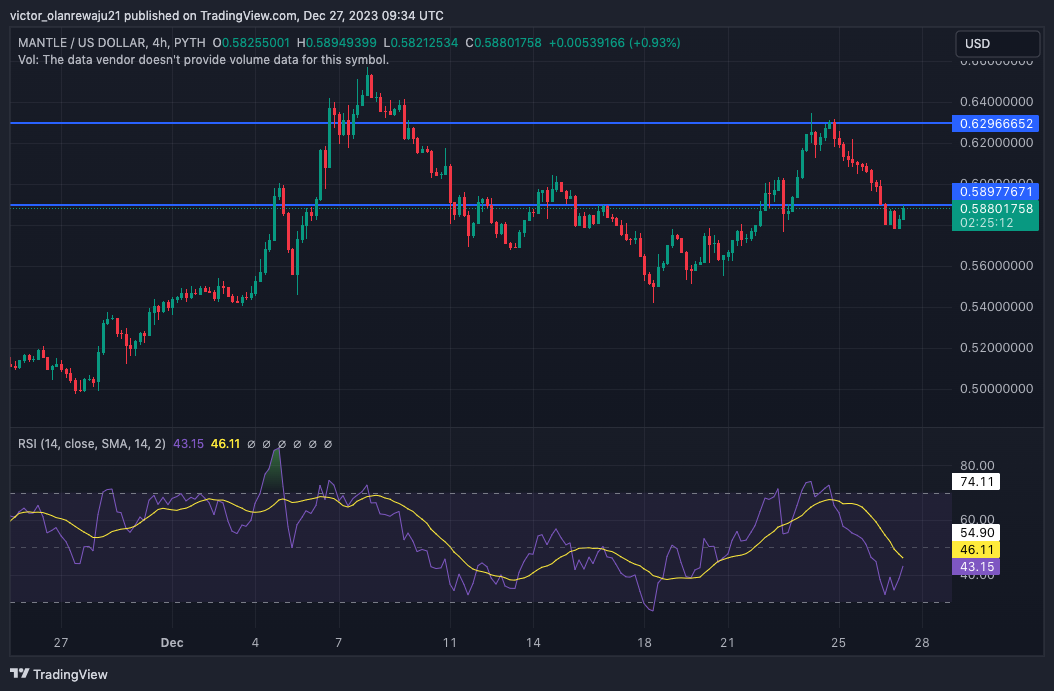
As of this writing, the cryptocurrency’s price was $0.58. The 4-hour MNT/USD chart showed that the token faced selling pressure after it hit $0.62.
However, MNT might be ready to run up the charts again, as indicated by the Relative Strength Index (RSI). On December 26, the RSI was 31.18, suggesting that the token was previously overbought.
But at the time of writing, the RSI reading has returned in an upward direction. This movement implies an increase in buy orders for MNT. Should the buying pressure increase, then MNT may cross $0.62 one more time. This could also help the cryptocurrency hit a new All-Time High (ATH).
MetisDAO (METIS)
MetisDAO (METIS) employs the DAO model to solve the cost, speed, and scalability issues on Ethereum. The project is ranked number 134 as per market capitalization. However, the 233% seven-day increase shows that the token has the potential to become a top 100 cryptocurrency. At press time, METIS’ price was $89.40.
Furthermore, Coin Edition checked out the Moving Average Convergence Divergence (MACD). As of this writing, the MACD was 1.92. The positive MACD indicates that METIS has formed a bullish divergence.
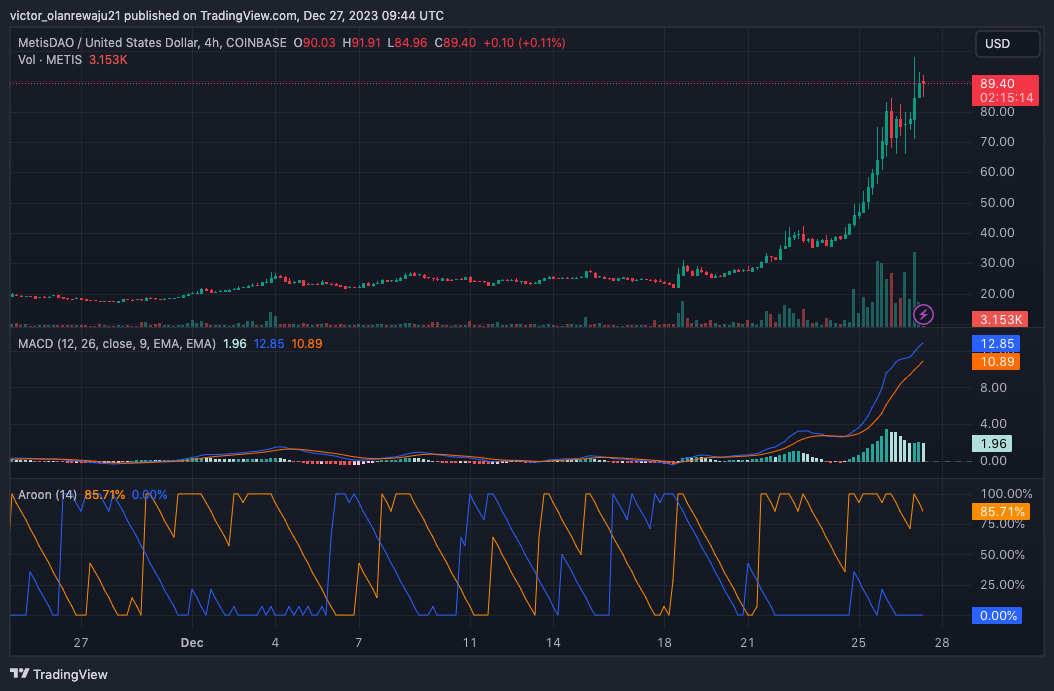
Another indicator considered is Aroon. At press time, the Aroon Up (orange) was 85.71%, while the Aroon Down (blue) was much lower. The positions of the Aroon up and down were a sign that the strength of the bullish trend was immense. So, the price of METIS had the potential to increase further.
Loopring (LRC)
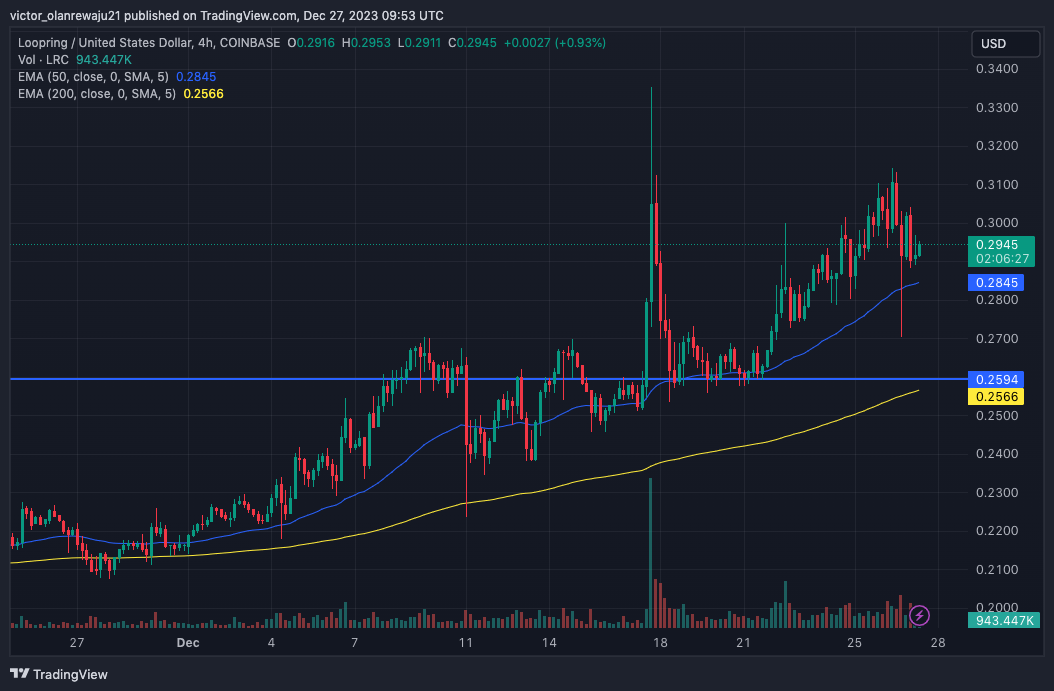
Loopring (LRC) runs on Ethereum and uses the Zero-Knowledge (ZK) proof to improve payment and low-cost trading on the blockchain. The price of LRC was $0.29 as of this writing. But since holding the support at $0.25, bulls have found it hard to push the LRC price toward $3.
In the mid to long term, LRC might be able to cross the $3 mark. This conclusion was taken from the EMA. LRC’s 50-day EMA (blue) crossed over the 200 EMA (yellow), indicating a potential rally in a few months.
SKALE (SKL)
SKALE Network (SKL) uses the modular blockchain system to bring scalability to Ethereum. As a result of the solution, there has been an increase in SKL. This adoption was vital in the 354.50% price increase in the last several days.
Going into 2024, there could be a further hike in the SKL price. The SKL price at press time was $0.064. Per the 4-hour chart, the Awesome Oscillator (AO) had decreased to 0.073, indicating increasing downward momentum.
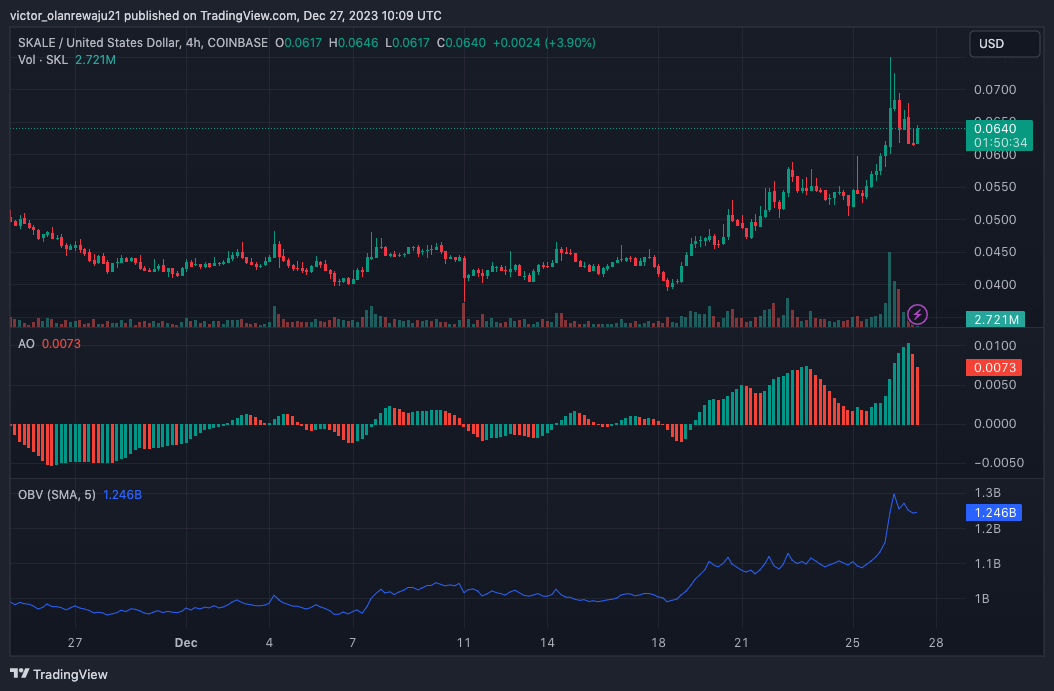
However, the On Balance Volume (OBV) showed an increase in buying pressure. Therefore, SKL remains a cryptocurrency with good long-term potential. Traders should also watch out for the movement of ETH. If ETH rises, there is a high chance that SKL might follow in a similar direction.
ethDYDX (ETHDYDX)
At press time, ethDYDX was undergoing a move to the dYdX chain. This movement is to ensure that the project scales Ethereum and enables seamless bridging on the blockchain. For the token, the price has increased by 73.75% in the last three months.
ETHDYDX’s potential breakout might largely depend on the number of bridges between the dYdX chain and Ethereum. If market participants bridge more tokens between the chains, then demand for ETHDYDX might increase, which could also affect its price positively.
Neo (NEO)
Neo (NEO) has been tagged as the Chinese version of Ethereum. One of the reasons for this comparison is that the project acts as an open-source platform for scaling payments and smart contracts.
NEO’s price at press time was $13.98—almost double the value it had 30 days ago. Considering the NEO/USD 4-hour chart, NEO may be preparing for another leg up as 2024 approaches.
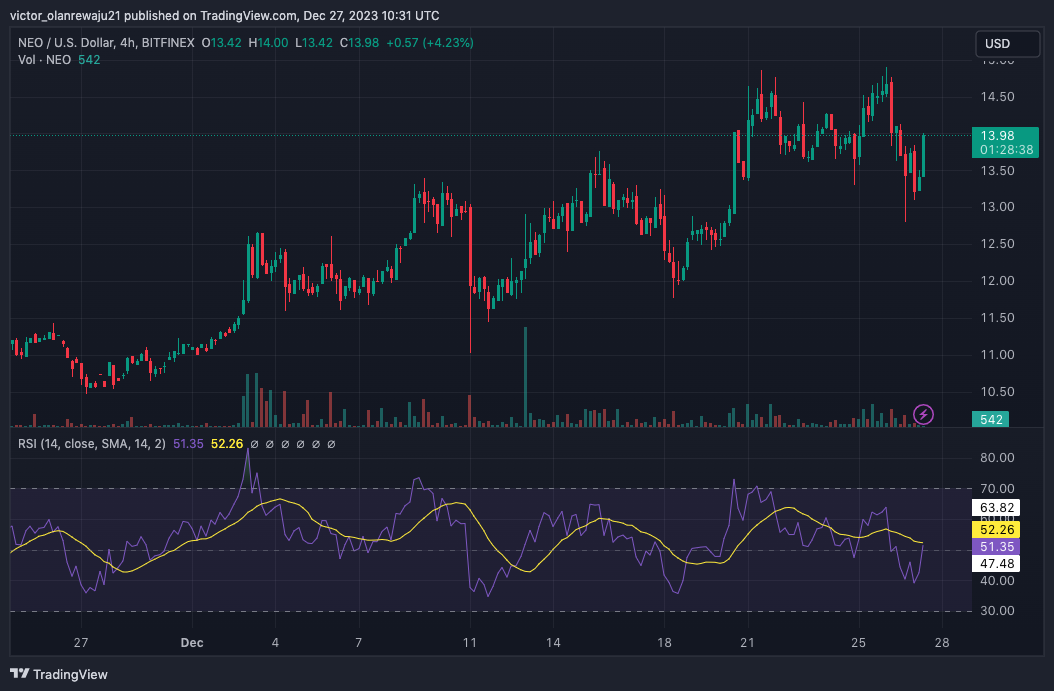
This was because of the Relative Strength Index (RSI). As of this writing, the RSI had hit 51.35. The jump above the 50.00 midpoint implies rising bullish momentum. If the momentum remains the same, it could only be a matter of time before NEO hits $15.
Disclaimer: The information presented in this article is for informational and educational purposes only. The article does not constitute financial advice or advice of any kind. Coin Edition is not responsible for any losses incurred as a result of the utilization of content, products, or services mentioned. Readers are advised to exercise caution before taking any action related to the company.


