, Polygon (MATIC), Polkadot (DOT)")
- Recently, the price of Solana (SOL) has increased by 0.38% to reach $31.74.
- In a recent price review, bears dominated the market for Polygon (MATIC).
- Bears outnumber bulls as Polkadot (DOT) prices decline by 1.20% to $6.50.
Solana (SOL)
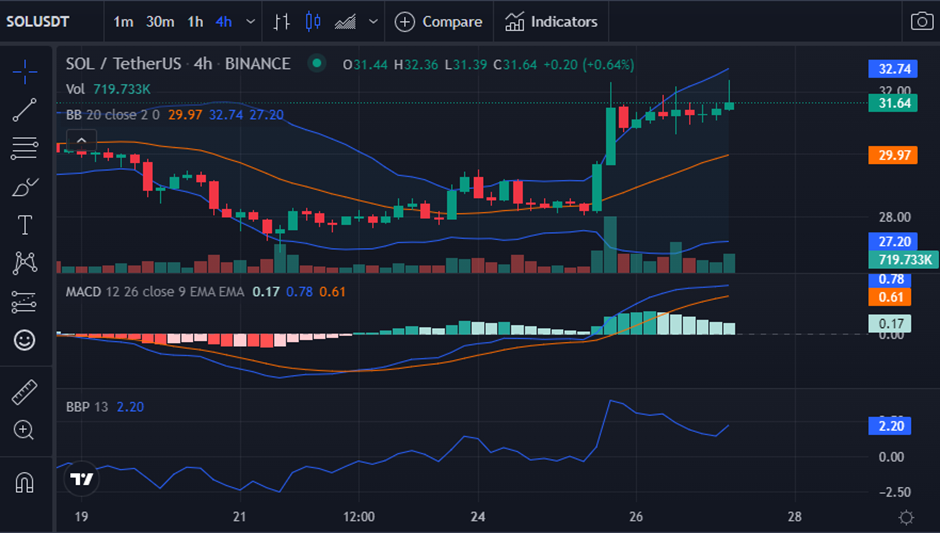
Bulls in Solana (SOL) have seized control of the market, continuing the bullish trend by driving prices up 0.38% to a value of $31.84.
This market attitude is supported by Bollinger bands, which are bulging and indicating increased market volatility. The market is also advancing towards the upper band, indicating upward momentum, as the upper band crosses 32.78 and the lower band touches 27.18.
The MACD indicator crosses above the signal line and in the positive area on the 4-hour chart with a reading of 0.79. This means that the SOL market’s strong momentum is likely to continue.
Positive momentum is indicated by the Bull Bear Power’s (BBP) reading being in the positive range and above zero. It points north and has a reading of 2.17, reinforcing the bullish sentiment.
Bulls must raise prices and maintain the $32.20 resistance level if they want to prevent a meltdown.
Polygon (MATIC)
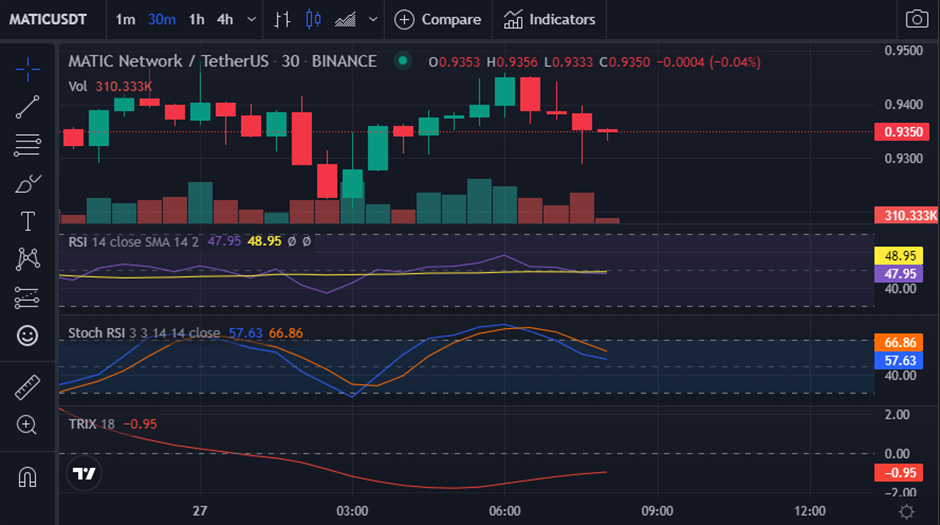
At the time of writing, bears were in charge of the MATIC market after bullish momentum faltered. Price shot down by 0.64% to $0.9335.
With a score of 48.72, the Relative Strength Index (RSI) is pointing south. This indicates that the MATIC market is seeing increased selling pressure, and as a result, bears are outnumbering bulls.
In recent hours, the Stochastic RSI moved into the overbought zone, which reversed the upward trend and caused prices to decline. It reads 57.43 and is pointing south, indicating that the bears have taken control of the market.
-0.95 is the Triple Exponential Average’s (TRIX) reading. Since a negative score implies that market momentum is waning, this predicts that the decline may continue.
The MATIC market has been taken over by bears, who have managed to drive prices down. In order to buck this downward trend, purchasing pressure must outweigh selling pressure.
Polkadot (DOT)
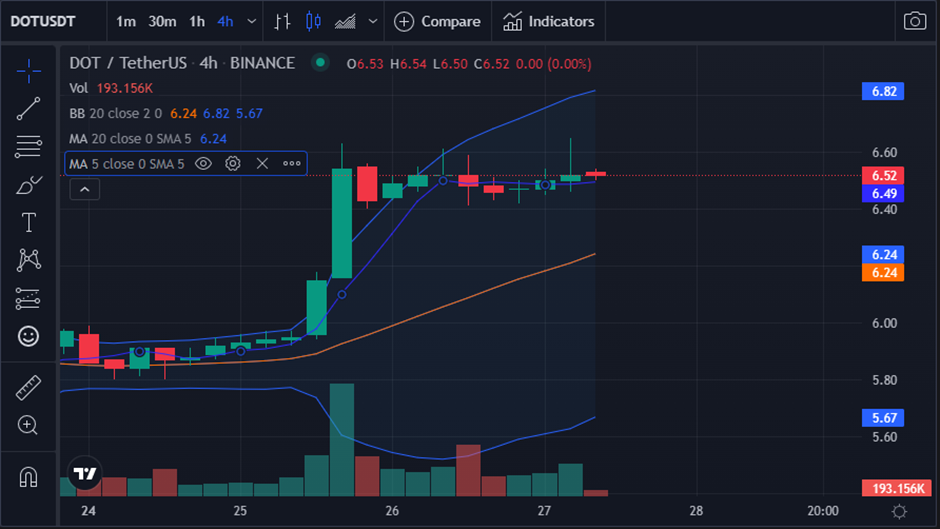
According to research on Polkadot pricing, the market is exhibiting a negative trend. Still in power and exceeding the bulls are the DOT bears. Additionally, DOT encounters resistance at $6.63 and support at $6.44. At the time of publication, Polkadot was priced at $6.50, a decrease of 1.20%.
A golden cross is formed when the 5-day moving average rises over the 20-day MA, signaling a bullish momentum in the DOT market. Due to the market price of DOT being above both MAs, this bullish trend is being supported hence suggesting the bearish momentum may be shortlived.
The Bollinger bands have widened, with the upper band touching 6.81 and the lower band touching 5.67, which suggests a rise in market volatility. Additionally, the market is moving upwards, indicating that the negative momentum may reverse.
The bulls need to hold the resistance level and drive prices higher in order to invalidate the current bearish trend.
Disclaimer: The views and opinions, as well as all the information shared in this price analysis, are published in good faith. Readers must do their own research and due diligence. Any action taken by the reader is strictly at their own risk, Coin Edition and its affiliates will not be held liable for any direct or indirect damage or loss
Disclaimer: The information presented in this article is for informational and educational purposes only. The article does not constitute financial advice or advice of any kind. Coin Edition is not responsible for any losses incurred as a result of the utilization of content, products, or services mentioned. Readers are advised to exercise caution before taking any action related to the company.


 Price Prediction: UNI Eyes $5 as UNI Extends Bullish Breakout")

