


- Santiment shared that DOT, KSM, ADA, LINK, and HBAR are the top 5 cryptocurrency projects in terms of development activity.
- All of the top 5 projects included on Santiment’s list saw their prices rise over the past 24 hours.
- HBAR specifically caught traders’ attention after its price surged by more than 9%, and technicals suggest it could target $0.0640 next.
Polkadot (DOT) and Kusama (KSM) were the two cryptocurrency projects that recorded the most development activity over the past month, according to an X (Twitter) post shared by market intelligence platform Santiment yesterday. The other projects in the top 5 list that boasted high development activity were Cardano (ADA), Chainlink (LINK), and Hedera (HBAR).
Polkadot (DOT)
Like many other tokens, DOT experienced a price increase in the last 24 hours. According to CoinMarketCap, the price of the altcoin increased by 0.86%, reaching $3.99 at press time. However, DOT’s price had dropped by more than 6% throughout the past week.
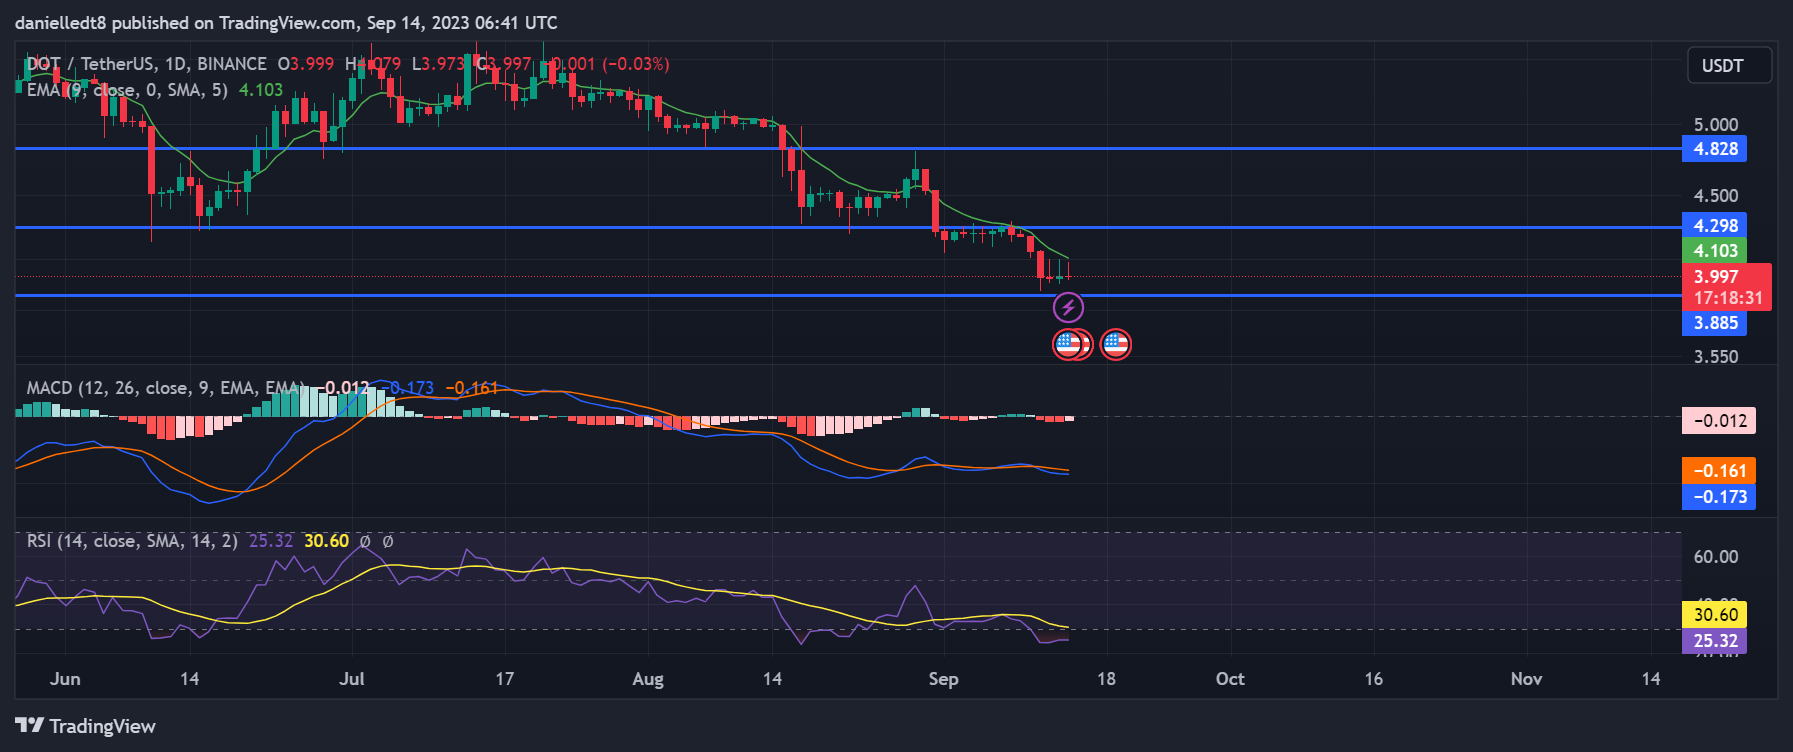
Despite recording the highest level of development activity over the past month, DOT’s price had been in a gradual descent during this same time period. This sell momentum continued up until Monday as sellers attempted to drag SOL’s price to below the $3.885 support level.
Bears were unable to breach the key level, however, which resulted in SOL’s price consolidating over the next 48 hours. At press time, technical indicators suggested that SOL’s bearish trend may undergo a bullish reversal.
The first indicator that supported this bullish thesis was the daily MACD line which was closing in on the daily MACD Signal line. If these two technical indicators cross, it will confirm the anticipated bullish trend reversal. The second indicator to keep an eye on is the daily RSI on DOT’s chart.
The daily RSI line was attempting to cross above the daily RSI SMA line. These two lines crossing will indicate that buyers have gained the upper hand. If these technical flags are validated, DOT’s price may attempt to break above the immediate resistance level at $4.298 in the following few days.
Thereafter, a daily candle close above this mark will flip the level into support. This will then give DOT’s price the foundation needed to rise toward the next resistance level at $4.828.
The bullish thesis will be invalidated if DOT is unable to close a daily candle above the 9-day EMA line at around $4.103 within the next 48 hours. In this scenario, DOT may be at risk of losing the support of the $3.885 price point in the coming few days.
Kusama (KSM)
KSM’s development efforts propelled it to tie with DOT for the top position, noted Santiment. Meanwhile, at press time, KSM was valued at approximately $17.90, marking a modest 0.61% increase in the last 24 hours. Moreover, KSM’s 24-hour trading volume surged by 8.28%, reaching a total of $6,841,257.
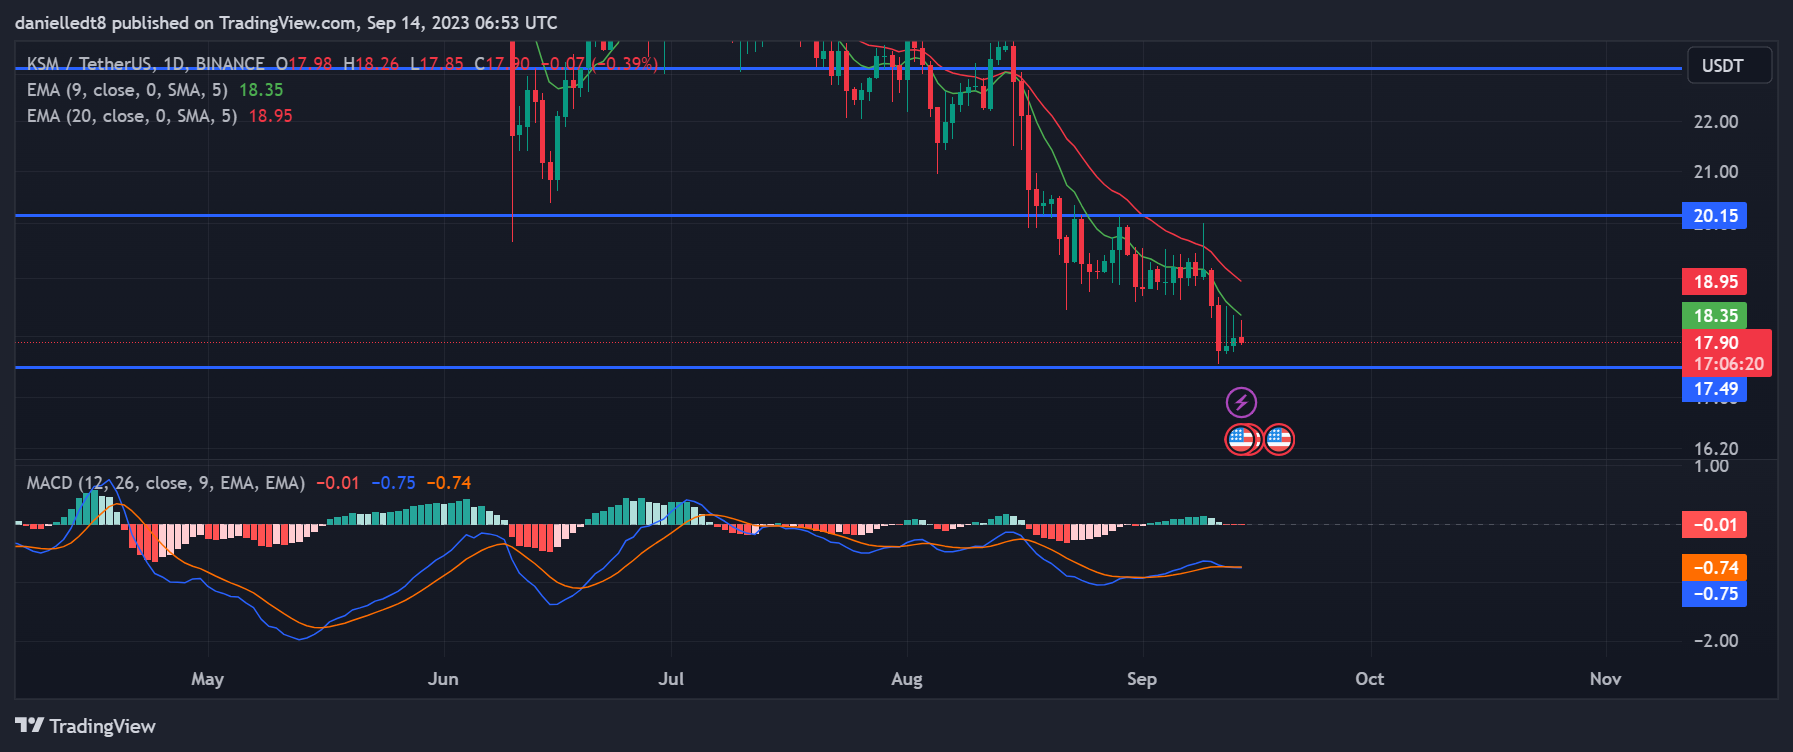
Similar to DOT, KSM’s price had rebounded off a key support level over the past 48 hours. During this time, the altcoin’s price bounced off of the $17.49 support level and has since climbed to attempt a challenge at the 9-day EMA line at $18.36. If KSM is able to close a daily candle above this technical indicator today, then it may continue to rise.
In this bullish scenario, KSM’s price may look to overcome the 20-day EMA line as well before potentially flipping the $20.15 resistance level into support. A daily candle close above this level will clear a path for KSM’s price to climb to the subsequent threshold at $23.12 within the following 2 weeks.
Conversely, KSM not closing today’s daily candle above the 9-day EMA line may result in KSM’s price undergoing a correction in the coming few days. This could then result in KSM dropping back down to $17.49.
Traders and investors will want to keep an eye on the MACD indicator on KSM’s daily chart as a notable bearish technical flag triggered recently. The daily MACD line crossed below the daily MACD Signal line, indicating that KSM’s bearish trend may continue in the next 24-48 hours.
Cardano (ADA)
ADA’s development activity earned it the 3rd position on Santiment’s list. With regards to the Ethereum-killer’s price performance in the past 24 hours, CoinMarketCap indicated that the altcoin saw its price jump 1.01%. As a result, ADA was trading at $0.2472 at press time, which was right between its 24-hour peak of $0.2518 and its daily low of $0.2444.
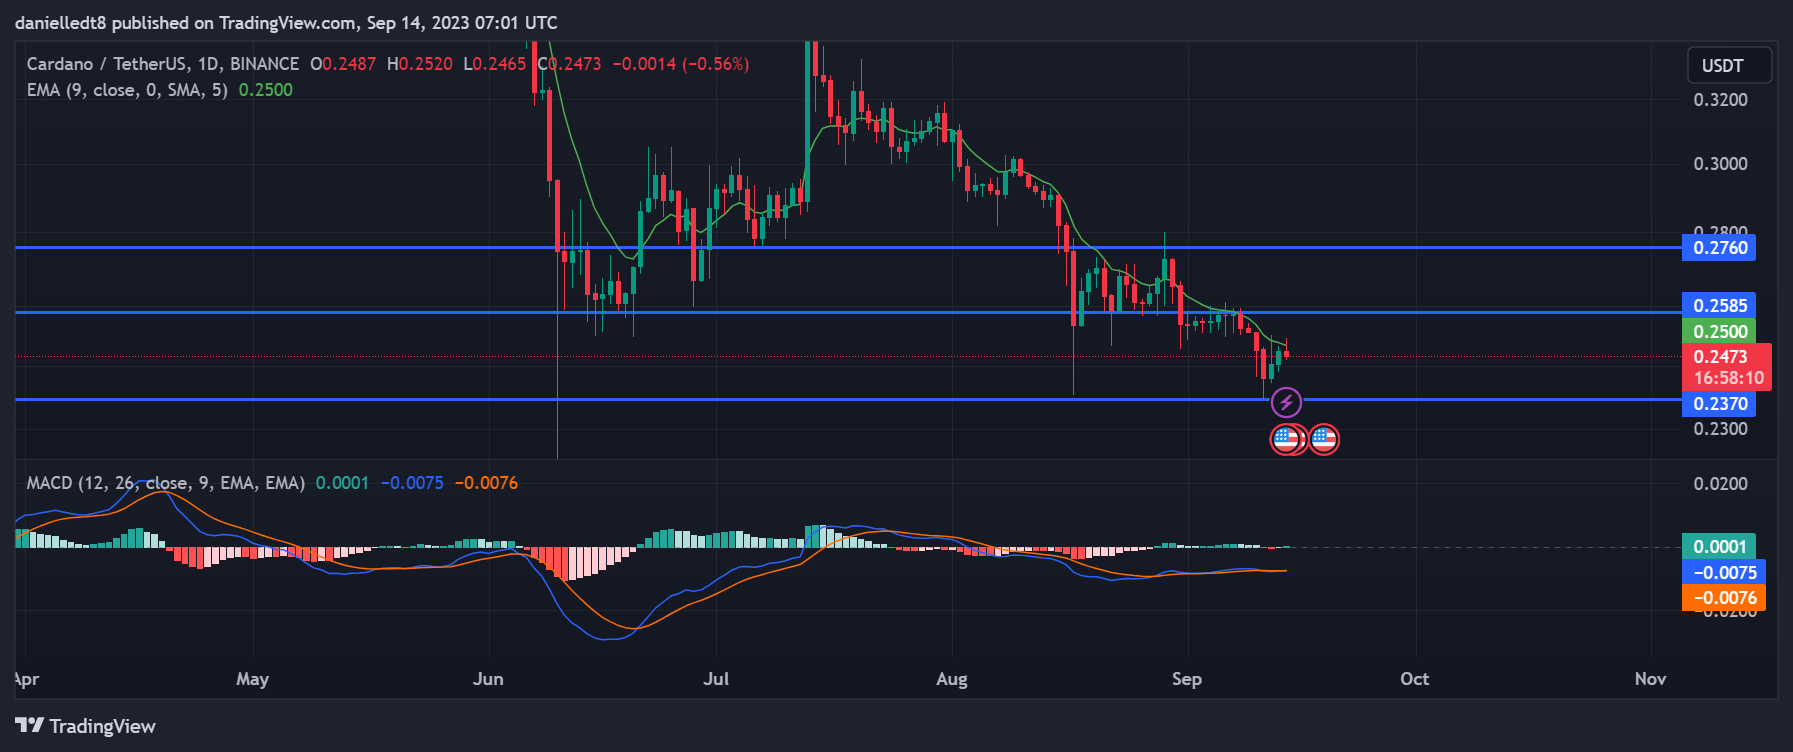
ADA’s price was attempting to cross above the 9-day EMA line on its chart at press time. A daily candle close today above this indicator may be followed by the altcoin’s price flipping the $0.2585 resistance level into support as well. Thereafter, the cryptocurrency will have a clear path to rise to the next key mark at $0.2760 in the following 48 hours.
On the other hand, a rejection from the 9-day EMA line today may put the altcoin at risk of retesting the immediate support level at $0.2370 in the next 48 hours. Investors and traders will want to take note of the fact that the daily MACD line was attempting to cross above the daily MACD Signal line. If these lines cross, it will signal a bullish trend reversal for ADA.
Chainlink (LINK)
Santiment’s analysis placed LINK as the fourth most actively developed project in the last month. Additionally, the altcoin’s price saw a 1.41% uptick in the past 24 hours, bringing it to a trading price of $6.03. However, for LINK to return to a positive weekly performance, it needs to gain more than 4% in value.
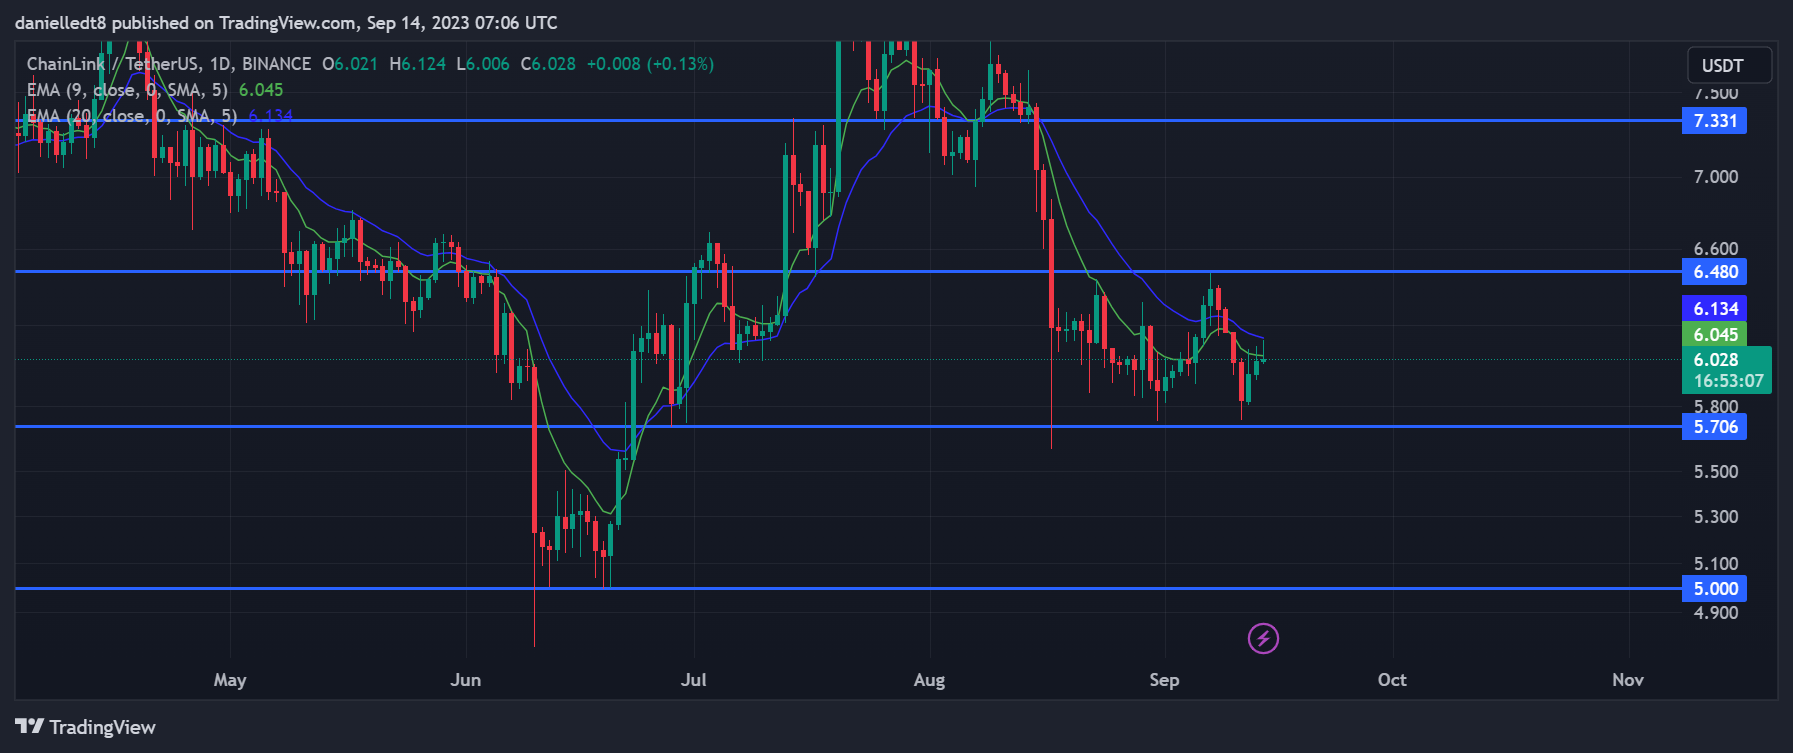
Similar to ADA, LINK’s price was also attempting to flip the 9-day EMA line on its chart into support at press time. The altcoin’s price had been in a steady climb over the previous 48 hours that saw it rise from a low of $5.737 to trade at its current level. Short-term momentum was still bearish, however, as the 9 EMA line was positioned below the 20 EMA line.
Nevertheless, a daily candle close above both of these EMA lines may be an early sign of LINK’s bearish trend coming to an end. If LINK is able to maintain a position above the 9-day and 20-day EMA lines in the next 48 hours then it could have the support needed to overcome the next barrier at $6.480.
A daily candle close above this level will open up the possibility of LINK’s price continuing to climb in the subsequent fortnight. Should the bullish momentum continue, the altcoin’s value could rise to as high as $7.331 during this period.
This bullish thesis will be invalidated, however, if LINK is not able to close a daily candle above the 20-day EMA line at around $6.082 within the coming 48 hours. This may then result in LINK’s price falling to $5.706 in the following couple of days. Continued sell pressure may then lead to LINK’s price losing this support level and dropping to $5.
Hedera (HBAR)
HBAR secured the fifth position on Santiment’s monthly development activity rankings. Additionally, the altcoin garnered attention by experiencing a notable price surge of over 9% in the last 24 hours. Meanwhile, HBAR’s 24-hour trading volume reached approximately $94,542,087, marking an impressive 303.87% increase compared to the previous day.
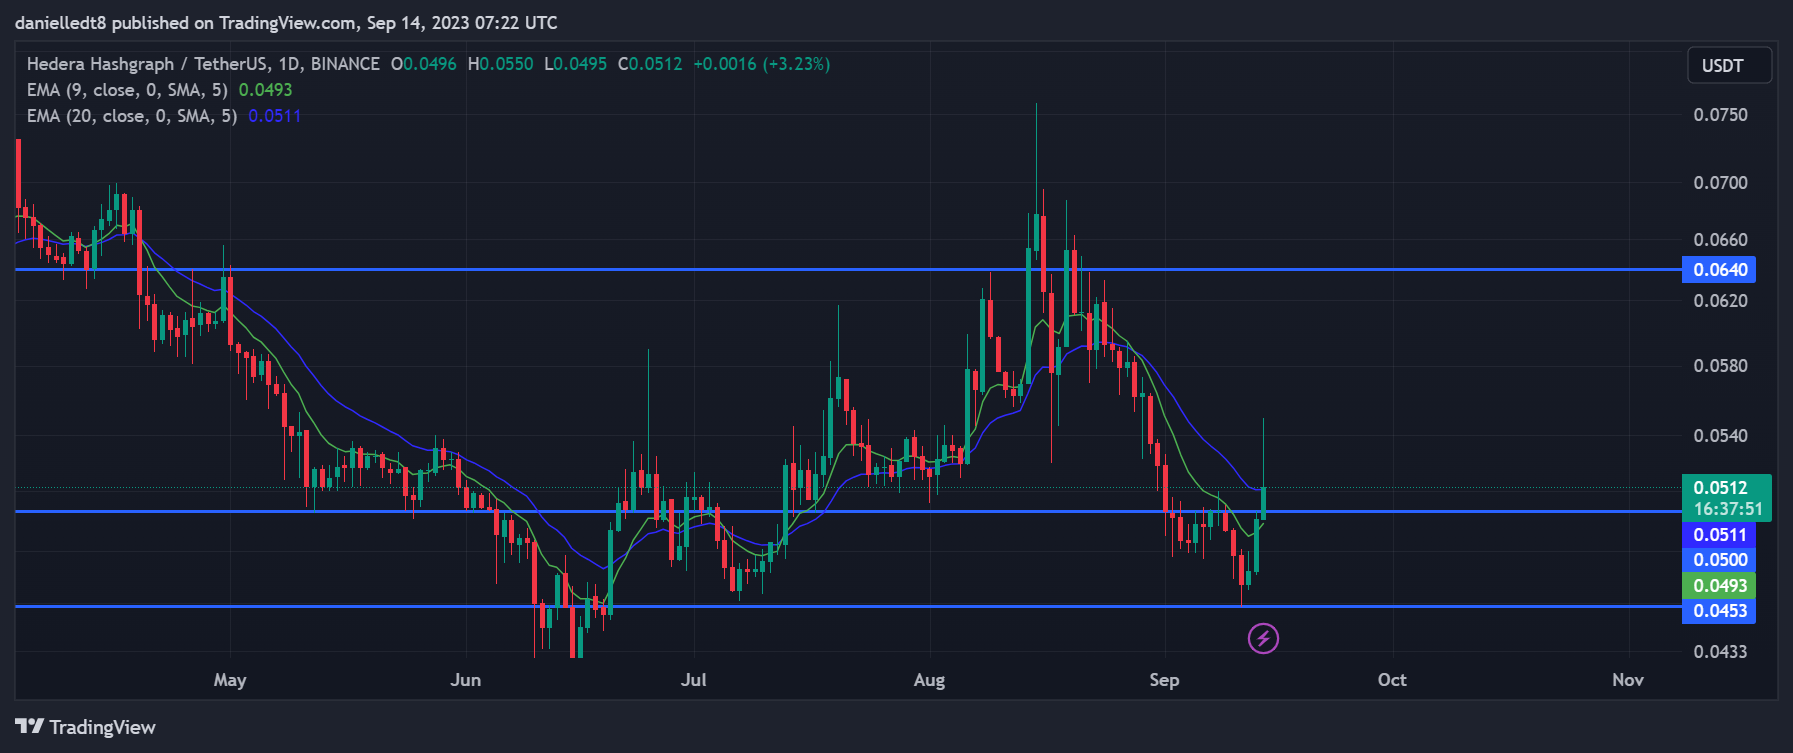
HBAR was able to surge above a key barrier over the past 24 hours. During this time, the cryptocurrency’s price broke above $0.05 and continued to trade above this price point at press time. If HBAR closes today’s trading session above this point, then it could have a clear path to the next resistance level at $0.0640.
Confirmation of HBAR continuing to climb to this next threshold will be when it closes 2 consecutive daily candles above the 20-day EMA line, which was situated at $0.0511 at press time. Conversely, a daily close today below $0.05 could put the altcoin at risk of testing the key support level at $0.0453 in the coming few days.
Disclaimer: The views and opinions, as well as all the information shared in this price analysis, are published in good faith. Readers must do their own research and due diligence. Any action taken by the reader is strictly at their own risk. Coin Edition and its affiliates will not be held liable for any direct or indirect damage or loss.
Disclaimer: The information presented in this article is for informational and educational purposes only. The article does not constitute financial advice or advice of any kind. Coin Edition is not responsible for any losses incurred as a result of the utilization of content, products, or services mentioned. Readers are advised to exercise caution before taking any action related to the company.


