


In the last few months, Binance has listed several new cryptocurrencies. Some were introduced via the Binance Launchpad while others passed through the usual exchange listing procedure.
In this article, Coin Edition looks at seven cryptocurrencies — how they have performed and what potential they could have in the short to long term.
Sleepless AI
First on the list is Sleepless AI (AI). Sleepless AI launched as a project willing to combine the potential of blockchain technology and the budding Artificial Intelligence ecosystem. The project also mentioned one of its fundamentals in integrating these technologies with the gaming space.
At press time, AI’s price was $1.29 as it has lost 7.50% of its value in the last seven days. However, there are speculations that AI will become one of the best-performing assets this year because of its ticker.
From the 2-hour chart, AI seemed to be in price discovery mode considering it only came into the market a few weeks back.
However, indications from the RSI showed that the price could rise if the reading crosses 55 or 60. But for now, AI is stuck.
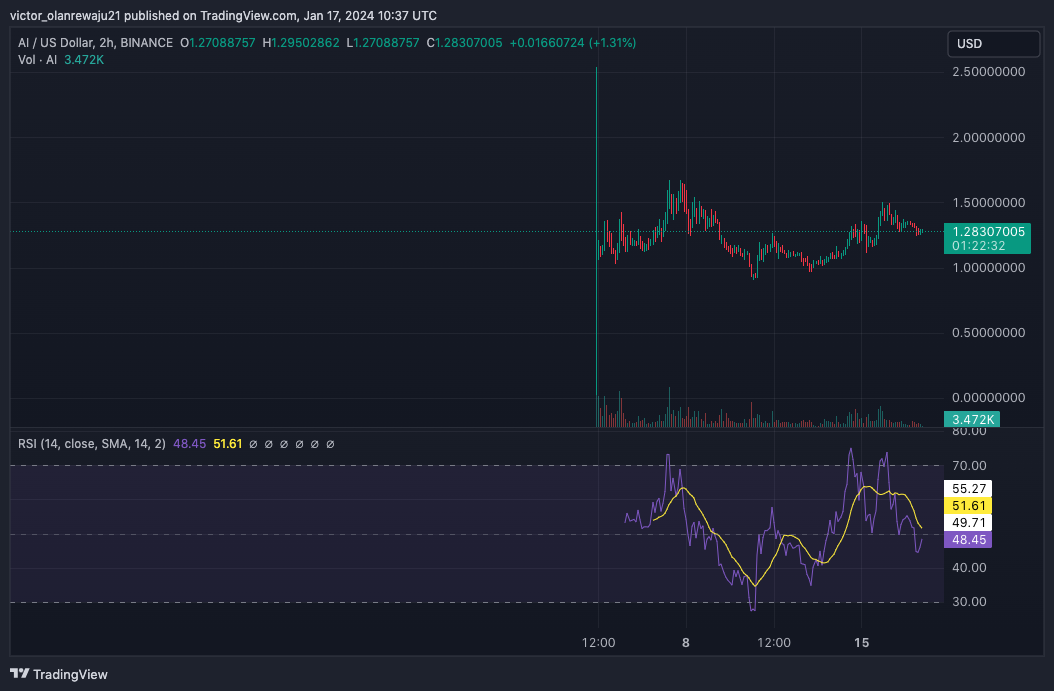
AI/USD 2-Hour Chart (Source: TradingView)
Outside of the technical outlook, the cryptocurrency might pump if major development comes to the AI space. So, investors might need to watch out.
Xai (XAI)
Xai’s fundamentals are similar to that of Sleepless AI. However, Xai does not deal with Artificial Intelligence but only focuses on the gaming part.
In terms of CoinMarketCap showed that XAI Price had increased by 88.36% in the last seven due to the large demand for the token.
As of this writing, the price had hit $1. However, signals from the RSI indicated a decline. If the demand for the cryptocurrency fails to return soon, the price might drop to $0.95.
This was also supported by the MACD which showed that the 26-day EMA (orange) had flipped the 12-day EMA (blue).
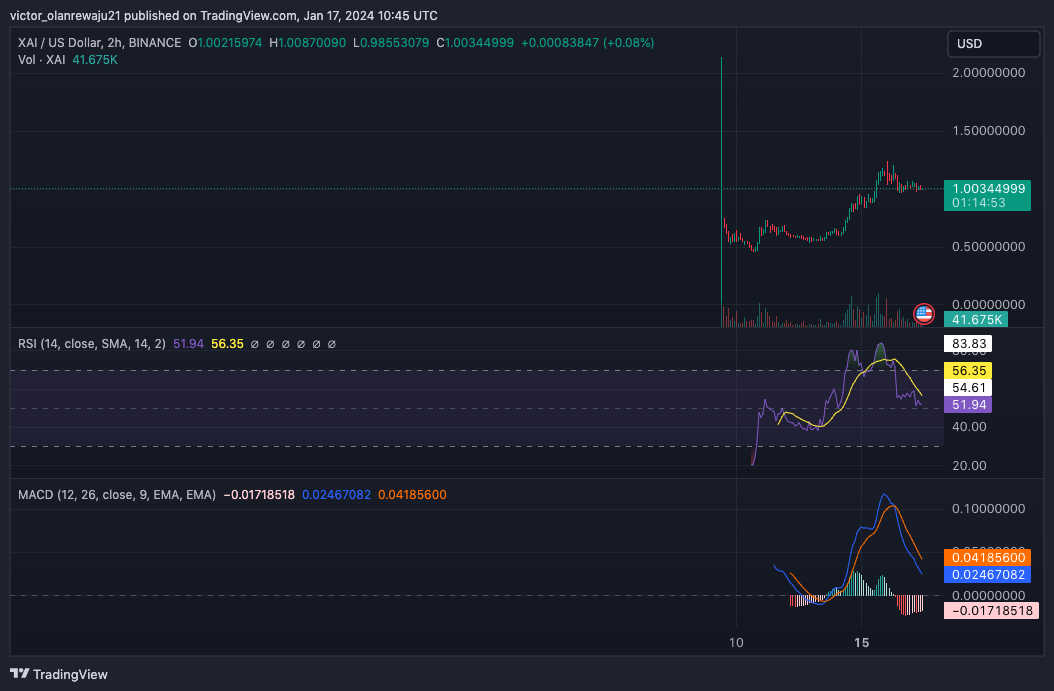
XAI/USD 2-Hour Chart (Source: TradingView)
ORDI
Unlike AI and XAI, ORDI is not a gaming token. Instead, it was built under the Bitcoin Ordinals ecosystem.
ORDI’s price has increased by 188% since its launch. This price increase was also vital to run above the $1 billion market cap.
Based on the 4-hour chart, the 20 EMA (blue) was 73.84. On the other hand, the 50 EMA (yellow) was 73.14. With the 20 EMA rising above 50, ORDI has more potential to pump than dump in the short to mid-term.
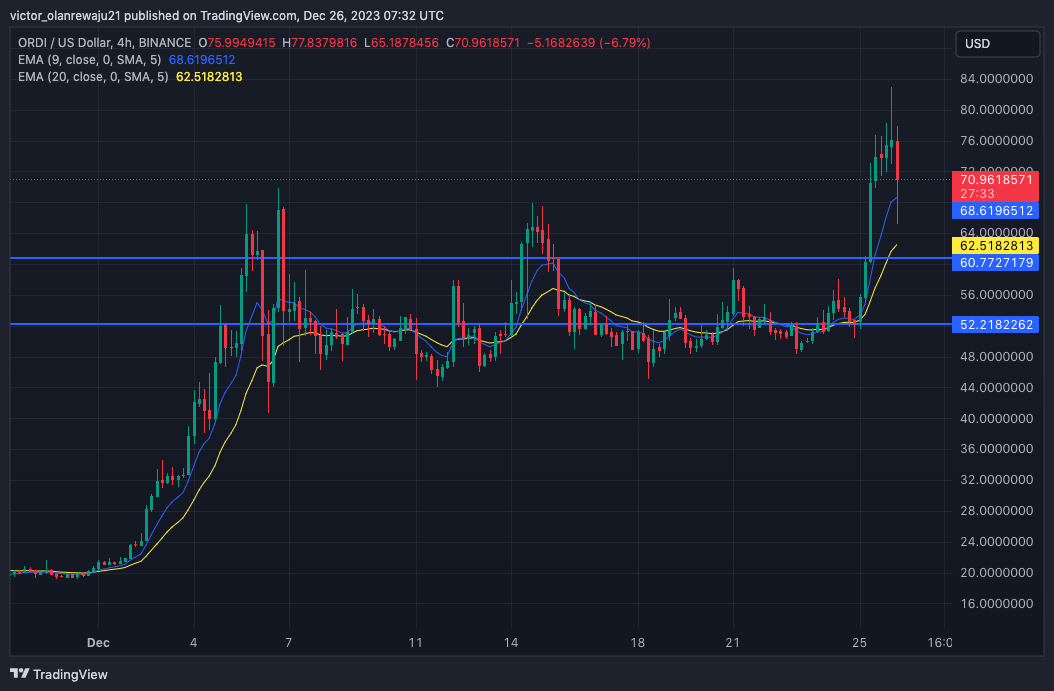
ORDI/USD 4-Hour Chart (Source: TradingView)
1000SATS (SATS)
1000SATS is another cryptocurrency built on the Ordinals system and listed by Binance. At press time, SATS’s price was $0.0006. This was almost the same price it was when it came into the market.
Although the price increased to $0.008 at one point, a 15.34% plunge in the last 30 days was the reason it came back to its former value.
Furthermore, indications from the Bollinger Bands (BB) showed that volatility was not high. This suggests that SATS might not experience a notable price fluctuation in the short term. In addition, the RSI supported consolidation.

SATS/USD 2-Hour Chart (Source: TradingView)
Fusionist (ACE)
For ACE, its price was still 24% down from its launch value. However, the Awesome Oscillator (AO) showed that the token could experience another increasing downward momentum.
This was because the AO was 0.41.at press time, with dominant red bars. If this remains the case, ACE might not be able to retest $10. Instead, it could move as low as $8.21.
The Chaikin Money Flow (CMF) was also down to -0.23, indicating that selling pressure was very much present. Should buyers fail to come to ACE’s aid, the value would most likely be dumped.
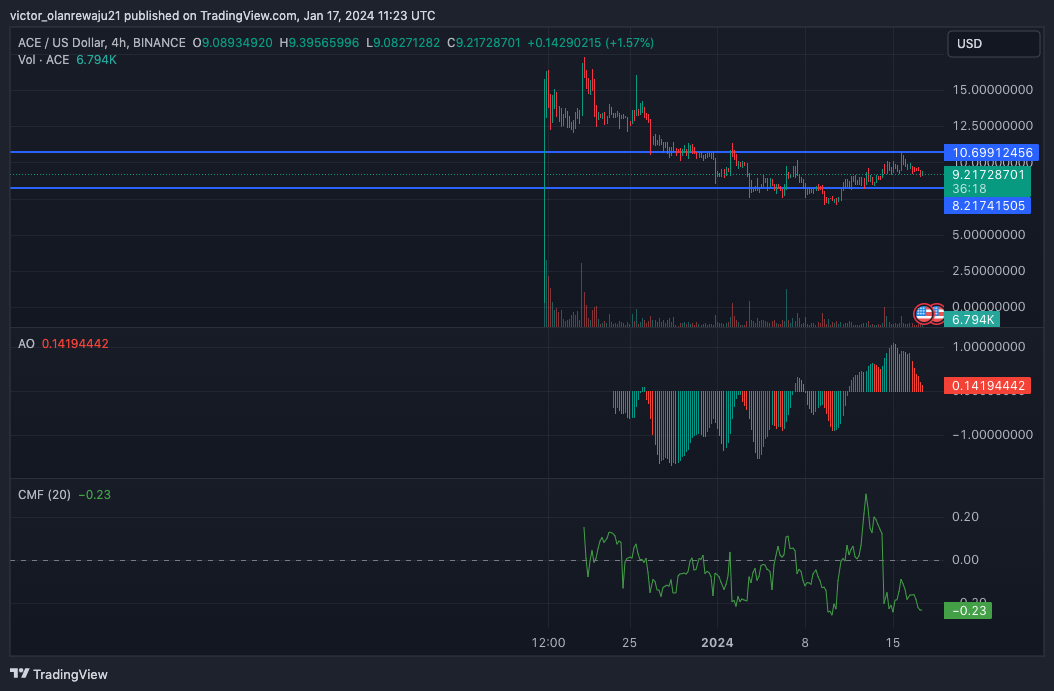
ACE/USD 4-Hour Chart (Source: TradingView)
Jito (JTO)
Jito’s price has increased by 63.76% in the last seven days. This was due to the exhaustion of selling pressure on January 10. As a result, the price jumped from $1.67 to $2.69.
However, signals from the AO showed that JTO’s value might still increase. This was because of the higher green bars. If the green bars remain present, then JTO could be on its way to reclaiming $3.50.

JTO/USD 4-Hour Chart (Source: TradingView)
Pyth Network (PYTH)
From the 2-hour PYTH/USD chart, the market structure had changed from bearish to bullish. This change also translated to a price increase that saw the token move from $0.23 to $0.40.
Meanwhile, the RSI at press time was 64.02, suggesting an increase in buying pressure. If bulls continue to defend the $0.32, then PYTH might have a chance at retesting $0.40.
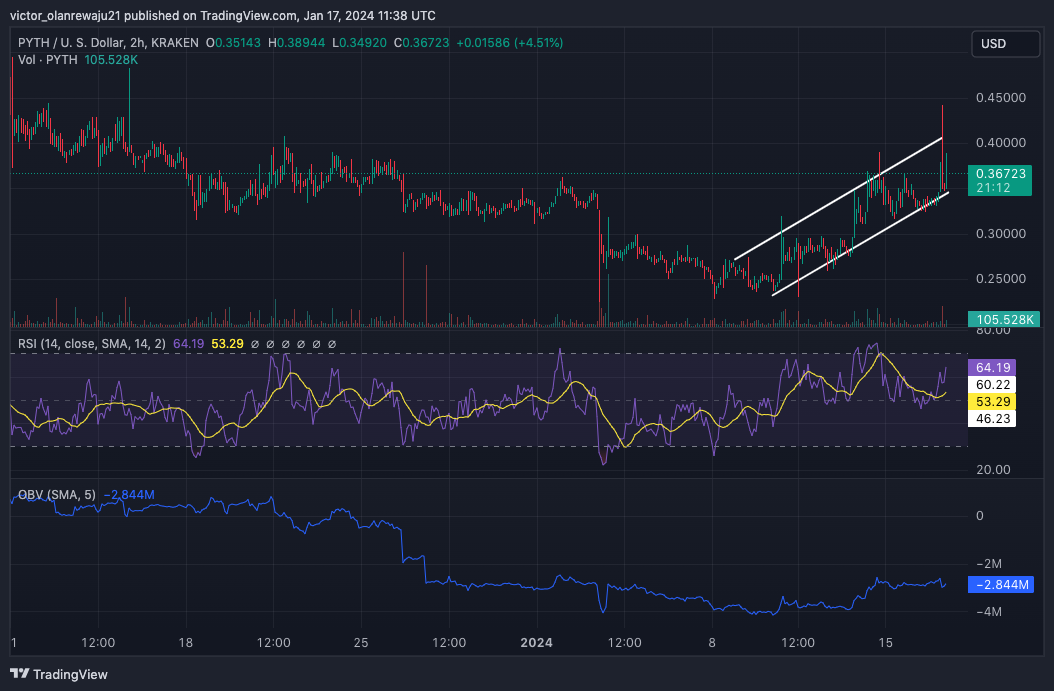
PYTH/USD 2-Hour Chart (Source: TradingView)
However, this might require the On Balance Volume (OBV) to exit its flat state and move higher. Should the OBV reading increase, then PYTH might hit $0.40. If not, it could continue hovering around $0.36.
Disclaimer: The information presented in this article is for informational and educational purposes only. The article does not constitute financial advice or advice of any kind. Coin Edition is not responsible for any losses incurred as a result of the utilization of content, products, or services mentioned. Readers are advised to exercise caution before taking any action related to the company.
 Price Prediction 2026, 2027, 2028, 2029, 2030-2050")


