


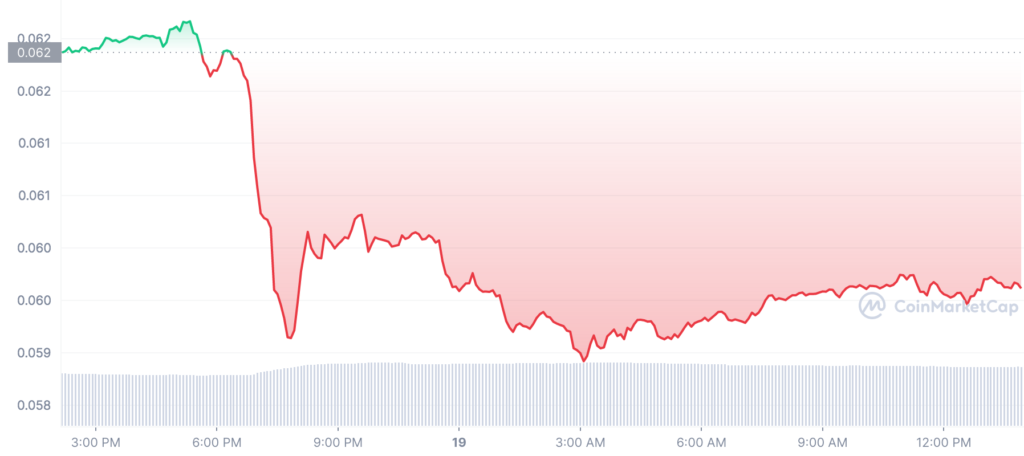
- Tron has dropped by 4% over the past day.
- The key resistance level for TRX/USD is $0.05707.
- Indicators anticipate a downgrade in price in the near term.
Given that the bears are in charge of the market and are likely to keep up their momentum, Tron (TRX) analysis shows that the cryptocurrency has been experiencing a downward trend today. The price has dropped by 4.03% to $0.05945 as a result of the bears.
The 24-hour trading volume increased by 14.28% to $245,136,671 while the market capitalization of TRX decreased by 4.05% to $5,457,781,017. This shows that the TRX market is volatile.
The overall cryptocurrency market is showing signs of a decline, and the downward momentum is expected to continue. However, by resisting negative pressure and assisting the token to achieve equilibrium, the bulls can still offer some support at 0.057.
The price has been moving in a bearish direction for the day, and the daily chart price analysis shows that TRX is confirming a fall in coin value. Because the TRX market price has been steadily rising over the previous few days, the situation is starting to favor the sellers.
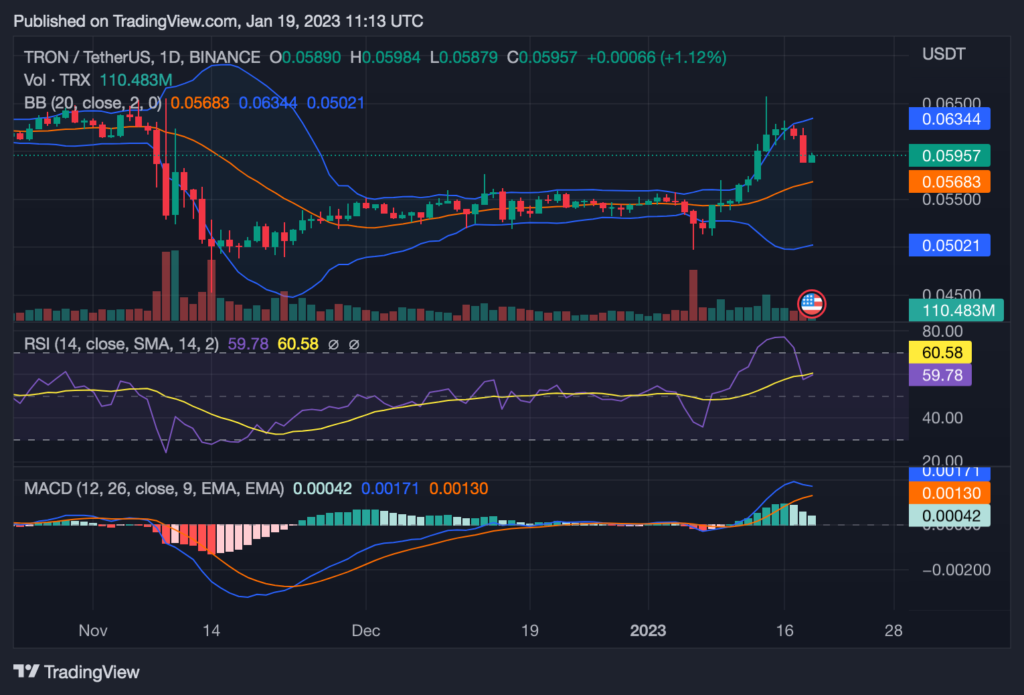
The moving average (MA) is 0.06001 higher than TRX’s current price. Due to the prior bearish trend, the SMA 20 curve is also dropping. A value of 0.00171 on the Moving Average Convergence Divergence (MACD) line indicates that the bearish trend will likely continue in the foreseeable future.
The Relative Strength Index (RSI) is at 60.58 indicating its moving to the overbought zone. The signal line has crossed above the RSI indicating that there would be additional bearish pressure, which also supports the bearish market mood.
It is challenging to forecast which way the market will move as the bulls and bears battle for dominance. However, the negative momentum is stronger right now, and TRX/USD will likely drop to $0.056 in the near term.
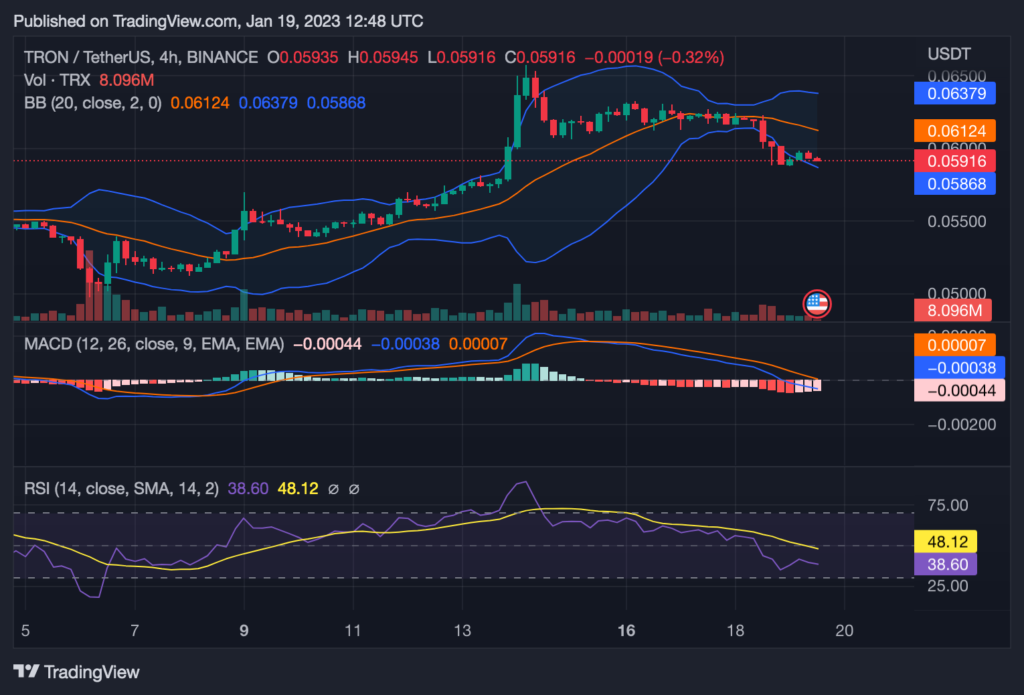
Analysis of the TRX price on a 4-hour chart reveals that the prices are still falling and are currently at $0.0591. The market has been under the influence of the bears for the previous few hours, and the short-term moving line has been sinking.
The value of the cryptocurrency has suffered during the past four hours, with a noticeable price decline. Tron’s price is therefore more likely to experience a varied change on either extreme since market volatility is rising in response to a movement. This decline is anticipated to continue as the signal line has crossed over the MACD line.
Disclaimer: The views and opinions, as well as all the information shared in this price analysis, are published in good faith. Readers must do their own research and due diligence. Any action taken by the reader is strictly at their own risk, Coin Edition and its affiliates will not be held liable for any direct or indirect damage or loss.
Disclaimer: The information presented in this article is for informational and educational purposes only. The article does not constitute financial advice or advice of any kind. Coin Edition is not responsible for any losses incurred as a result of the utilization of content, products, or services mentioned. Readers are advised to exercise caution before taking any action related to the company.

: What Happens If You Use an Unlicensed Platform?")


