
- Bullish TRX price prediction for 2026 ranges from $0.45 to $0.60.
- TRX could hit $0.50 in 2026 if the symmetrical triangle resolves upward and a Coinbase spot listing materialises.
- The bearish TRX price prediction for 2026 is $0.24.
TRON is the world’s largest stablecoin settlement rail — $90 billion in USDT, $4.2 trillion in H1 transfers, more daily active addresses than Ethereum on its best day in June. The token is at $0.32, down 26% from its December 2024 ATH, and has moved exactly nowhere for three weeks. Whether that disconnect between network dominance and token price is a temporary lag or a permanent structural discount is the question every TRX price target below has to answer.
What Is Tron (TRX)?
TRON is a Layer-1 blockchain launched in 2018 by Justin Sun, running on Delegated Proof-of-Stake with 27 elected Super Representatives. Its EVM-compatible TVM supports Solidity smart contracts, the property that made it the cheapest and fastest base layer for Tether USDT issuance, which now defines everything about TRON’s real-world utility.
TRX functions as the network fee medium, staking collateral for bandwidth and energy credits that eliminate per-transaction gas for most users, and a partially deflationary asset through ongoing burns. The network currently mints 3.91M TRX daily versus 3.12M burned, net inflationary, the most underappreciated structural headwind in the entire TRX thesis.
TRX Current Market Status
| Metric | Value |
| Price (July 18, 2026) | ~$0.323 |
| All-Time High | $0.4365 (December 2024) |
| All-Time Low | $0.001002 (November 2018) |
| ATH to Current | -26% |
| Market Capitalization | ~$30.6B |
| CMC Rank | #8 |
| 24H Volume | $417M to $532M |
| Circulating Supply | ~94.87B TRX |
| USDT on TRON | $90B+ |
| H1 2026 Transfer Volume | $4.2 Trillion |
| Daily Transactions (record) | 14.3M (June 10) |
| YTD vs BTC | -1.3% vs -19% |
| Weekly SAR | $0.36446 (bearish, above price) |
TRX Price Prediction Overview 2026-2030
| Year | Bearish | Base | Bullish |
| 2026 | $0.24 to $0.28 | $0.32 to $0.42 | $0.45 to $0.60 |
| 2027 | $0.25 to $0.35 | $0.38 to $0.55 | $0.60 to $0.80 |
| 2028 | $0.30 to $0.45 | $0.50 to $0.75 | $0.85 to $1.10 |
| 2029 | $0.35 to $0.55 | $0.65 to $0.90 | $1 to $1.40 |
| 2030 | $0.30 to $0.50 | $0.60 to $1 | $1.20 to $2 |
TRX Price Prediction 2026: Technical Analysis
Weekly Symmetrical Triangle at Apex — SAR Bearish, EMAs Bullish
The weekly EMAs show all four stacked in correct bullish order below price: 20 EMA at $0.32518, 50 EMA at $0.30768, 100 EMA at $0.27059, and 200 EMA at $0.21122. Price at $0.323 sits right at the 20 EMA, the first meaningful weekly resistance on any continuation.
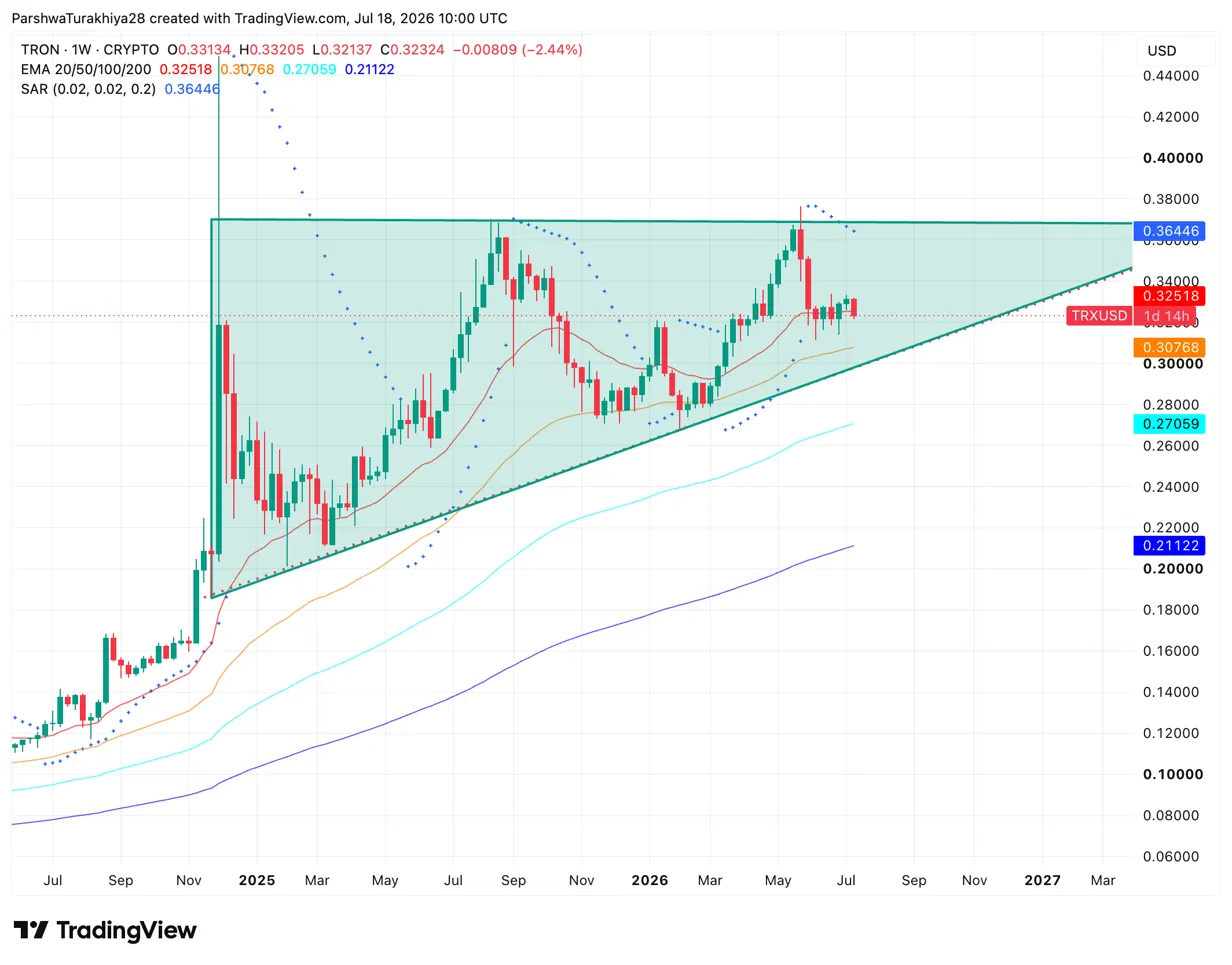
The dominant chart pattern is a symmetrical triangle running from the December 2024 ATH. The flat-to-declining upper boundary sits near $0.36 to $0.37 while the rising lower trendline runs from the late 2024 lows near $0.19, now at approximately $0.30 to $0.31. The triangle’s apex converges in late 2026, meaning a directional resolution is approaching on the weekly timeframe.
Price pulled back toward the lower trendline after the May 2026 peak near $0.37 to $0.38. A weekly close below $0.307 breaks the rising lower trendline and opens $0.27 to $0.28. A weekly close above $0.365 produces the first clean triangle breakout, with FXEmpire’s cup-and-handle target measuring toward $0.69.
The weekly Parabolic SAR at $0.36446 sits above price, a bearish trend signal. Every prior SAR dot above price during this structure corresponded to range-bound or declining price action. Flipping the SAR below price requires a sustained weekly close above $0.365 and is the signal that changes the trend from neutral to bullish.
Key TRX levels for 2026:
- Resistance: $0.32518 (20 EMA), $0.334 (neckline), $0.36446 (SAR / triangle upper), $0.40, $0.4365 (ATH)
- Support: $0.30768 (50 EMA / triangle lower), $0.28, $0.27059 (100 EMA)
TRX 2026 Fundamental Catalysts
$90B USDT and Record Network Activity
TRON surpassed Ethereum, BNB Chain, and Solana in daily active addresses on a single June day with 3.93 million per Lookonchain. CryptoQuant confirmed TRON generates $2M daily in transaction fees, roughly $730M annualised. These are on-chain records, not marketing claims, and they arrive at a time when the price has been flat for three consecutive weeks.
SEC Settlement and Regulated US Access
The March 2026 settlement cleared three years of enforcement overhang. All claims against Sun personally were dismissed with prejudice, leaving only a $10M civil penalty for Rainberry Inc. The direct consequence is a Bitnomial CFTC-regulated spot listing now live, with Anchorage Digital offering native TRX staking and TRC-20 custody at a federally chartered bank level.
Tron Inc. MicroStrategy Playbook
A Nasdaq-listed vehicle under the ticker TRON filed a $1 billion shelf statement for continued TRX accumulation. Holdings crossed 700 million TRX in June with a purchase of 151,976 TRX at $0.329 representing a direct corporate buy signal at current prices.
The Structural Ceiling
Three bear forces are real and simultaneous. TRON mints 3.91M TRX daily versus 3.12M burned, net inflationary. Justin Sun and affiliates control approximately 63% of supply, and the 27-SR validator model is among the most centralised governance structures in the top 10. TRM Labs shows 58% of illicit crypto volume flows through TRON, and an Argentine judge froze TRON wallets in the Libra token investigation this week. TechBullion’s read is accurate: the market has priced in what the stablecoin rail delivers. The price does not move because there is no new information.
The unpriced catalyst that changes everything is a Coinbase US spot listing. TRX is not available on Coinbase in the US. The SEC settlement cleared the pathway and Bitnomial sets the precedent. Without it, the triangle continues compressing.
| Scenario | Price Range |
| Bullish | $0.45 to $0.60 |
| Average | $0.32 to $0.42 |
| Bearish | $0.24 to $0.28 |
TRX Price Prediction 2027
The burn rate question becomes actionable in 2027. The $100B USDT milestone on TRON, on pace for late 2026 or early 2027, could accelerate daily burns toward and eventually past the 3.91M daily mint rate. Net-deflationary TRX, even briefly, would be the structural signal the market has been waiting for since the token launched.
The WLFI lawsuit, Sun versus World Liberty Financial over frozen tokens and a counter-suit for defamation, will likely resolve in this window given Sun’s historical preference for settlement. A second US-regulated exchange listing building on Bitnomial’s precedent changes the institutional liquidity picture. The XRP parallel Sun referenced on X plays out here if institutional flows materialize post-resolution, though TRX’s settlement generated a fraction of the narrative heat that followed Ripple’s case.
| Scenario | Price Range |
| Bullish | $0.60 to $0.80 |
| Average | $0.38 to $0.55 |
| Bearish | $0.25 to $0.35 |
TRX Price Prediction 2028
The April 2028 Bitcoin halving historically triggers the broadest altcoin rotation of each four-year cycle. TRX entering that window as a $30B+ market cap asset with settled legal status, federally chartered custody, and USDT dominance over Ethereum participates in any rotation toward defensive large-cap Layer-1s.
Justin Sun announced in April that TRON’s post-quantum mainnet upgrade would deliver NIST-standardized post-quantum signatures, positioning TRON as simultaneously the world’s largest USDT rail and the first top-10 blockchain with quantum-resistant base-layer security. The $1 threshold requires both a strong macro cycle and a structural tokenomics change: either daily burns exceeding mints or a governance-approved fee distribution mechanism routing network revenue to TRX holders.
| Scenario | Price Range |
| Bullish | $0.85 to $1.10 |
| Average | $0.50 to $0.75 |
| Bearish | $0.30 to $0.45 |
TRX Price Prediction 2029
Post-halving cycle peaks historically arrive in the year following the halving event. By 2029, TRX will have operated for 11 years, past most existential questions about network survival, regulatory clarity, or institutional access. The critical variable is whether daily burns have structurally crossed daily mints.
If they have, TRX holders benefit from supply contraction for the first time in the token’s history — a genuine structural re-rating that no prior TRX cycle has had. If not, mild inflation persists as a ceiling even at peak cycle conditions.
| Scenario | Price Range |
| Bullish | $1 to $1.40 |
| Average | $0.65 to $0.90 |
| Bearish | $0.35 to $0.55 |
TRX Price Prediction 2030
By 2030, TRX is a 12-year-old network. The relevant long-term risk is not TRON failing. It is TRON succeeding at what it does while the economic value continues flowing to Tether rather than TRX holders. If USDT migrates meaningfully to a faster or more compliant chain by 2030, or if USDC on other rails erodes Tether’s dominance, the core value proposition of TRX erodes with it.
The base case assumes TRON retains a meaningful share of global stablecoin settlement, burns finally exceed issuance at some point in the 2028 to 2029 cycle, and the token has reached $1 during the bull peak before consolidating into 2030.
| Scenario | Price Range |
| Bullish | $1.20 to $2 |
| Average | $0.60 to $1 |
| Bearish | $0.30 to $0.50 |
Frequently Asked Questions
Will TRX hit $0.50?
At $0.323, $0.50 requires a 55% move and a clean break above the December 2024 ATH of $0.4365. The technical path runs through a weekly close above the triangle upper at $0.365 to flip the SAR bullish, then $0.40, then the ATH break. FXEmpire’s cup-and-handle measures $0.69 from that breakout. A Coinbase spot listing is the catalyst most likely to produce that sequence in 2026.
Why has TRX’s price not matched its network growth?
Three simultaneous reasons: net inflationary supply with 3.91M minted versus 3.12M burned daily, TRON’s $4.2T in stablecoin volume generating revenue for Tether rather than TRX holders, and a persistent institutional discount applied to the 63% supply concentration, 27-SR centralisation, and 58% illicit crypto volume association per TRM Labs. The market has priced in what the stablecoin rail delivers and is waiting for new information.
What is the most important near-term TRX catalyst?
A Coinbase US spot listing. TRX is not currently available on Coinbase in the US. The SEC settlement cleared the pathway, Bitnomial sets the precedent, and Anchorage institutional custody is operational. A Coinbase listing would be the single most significant liquidity event possible for TRX given Coinbase’s US retail dominance.
What is the TRX price prediction for 2028?
Average $0.50 to $0.75, bullish to $0.85 to $1.10 if the April 2028 Bitcoin halving tailwind, post-quantum mainnet, and net-deflationary supply all converge in the same window. The $1 mark requires macro conditions and structural tokenomics improvement aligning simultaneously.
What would make TRX deflationary?
Daily burns exceeding daily mints of 3.91M TRX for the first time in the network’s history. At $4.2T in H1 transfer volume growing toward $100B USDT, the burn rate is narrowing the gap but has not crossed. If the $100B USDT milestone and continued transaction growth push daily burns above 3.91M sustainably, TRX becomes net deflationary and the fundamental re-rating thesis has its missing piece.
What is the WLFI lawsuit risk?
Sun invested $75M in Trump’s World Liberty Financial, sued for fraud in April 2026 alleging frozen tokens, and WLFI countersued for defamation in May. The lawsuit is unresolved. Sun’s historical pattern is settlement over litigation. Resolution removes the most active headline risk, while a court loss adds another jurisdiction to his legal record and revives political scrutiny.
Conclusion
TRON is the most-used blockchain in the world by stablecoin settlement volume. It hosts $90B in USDT, processed $4.2T in H1 transfers, and runs at 14.3 million daily transactions. The token has done nothing for three weeks.
The weekly symmetrical triangle is converging toward resolution in late 2026 with the SAR still bearish above price, the 20 EMA providing the only immediate support, and $0.365 representing the dividing line between range continuation and breakout. The bull case of net deflation, a Coinbase listing, and WLFI resolution is structurally real. The bear case of Tether capturing the network’s economics, 63% supply concentration, and an illicit flow discount is equally structural.
Three weeks of price stasis on record network metrics is the market’s current answer to which story matters more.
Disclaimer: The information presented in this article is for informational and educational purposes only. The article does not constitute financial advice or advice of any kind. Coin Edition is not responsible for any losses incurred as a result of the utilization of content, products, or services mentioned. Readers are advised to exercise caution before taking any action related to the company.