


- TRON’s bullish wave continues despite a slight pullback; eyes are set on $0.07900 resistance.
- Caution is warranted as the TRX market approaches overbought territory.
- Aroon and MFI indicators signal continued bullish sentiment for TRX.
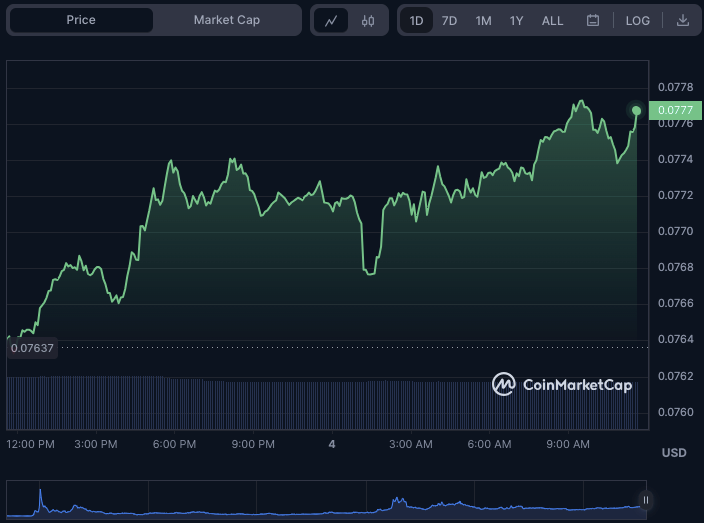
TRON (TRX) bullish momentum has been relentless in the last 24 hours, with bulls soaring the price from $0.07632 to $0.07773 before hitting resistance. TRON was trading at $0.07755 at press time, a slight decrease from its intraday high.
Despite the pullback, TRON’s upward trend remains strong, indicating that the bullish momentum may continue. However, while TRX’s market capitalization increased by 1.17% to $6,949,181,934, its 24-hour trading volume decreased by 9.13% to $174,568,907. This drop suggests that traders may hesitate to continue buying at the current price levels.
If bears regain market control and breach the $0.07632 support level, the next level to watch for is around $0.07600. However, if bulls regain control and push the price above the $0.07755 resistance level, it could signal a potential rally toward the next resistance level at $0.07900.
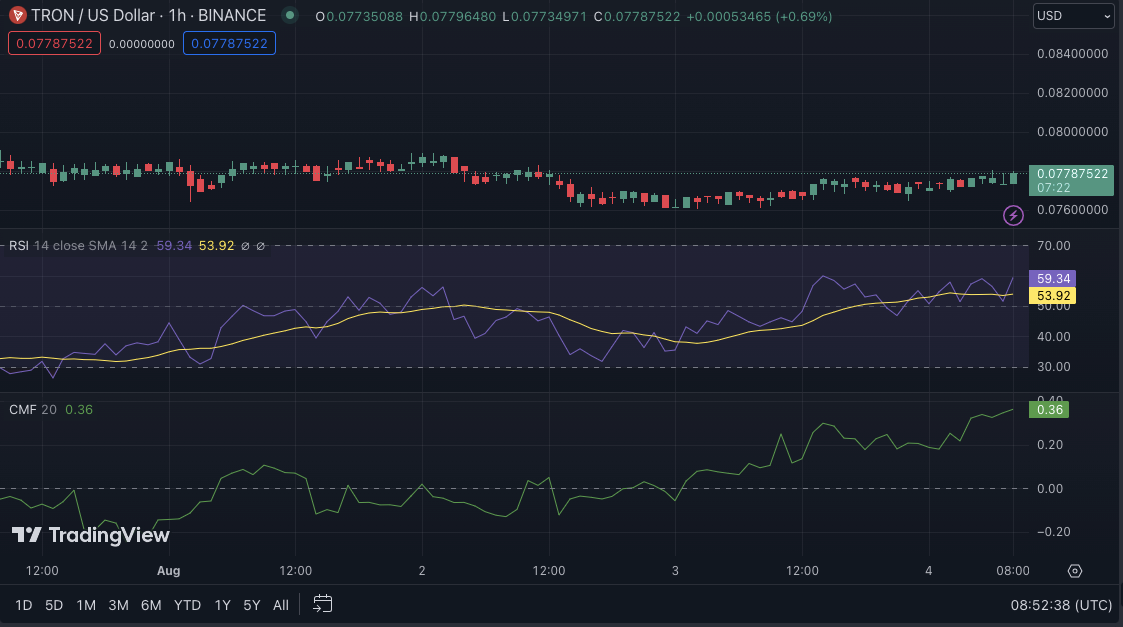
The TRXUSD 1-hour price chart’s Relative Strength Index (RSI) reading of 60.05 suggests that the bullish momentum may continue in the short term. This pattern suggests buyers are still in market control and may rise further.
However, traders should be cautious since the RSI reading is approaching overbought territory, indicating a possible reversal or correction soon.
With a reading of 0.33, the Chaikin Money Flow (CMF) indicates that there is still buying pressure in the market and money flows into TRXUSD. This pattern indicates that TRX is in high demand, and further price increases are possible. However, if the CMF reading rises and exceeds 0.5, it may indicate an overbought condition and potential selling pressure.
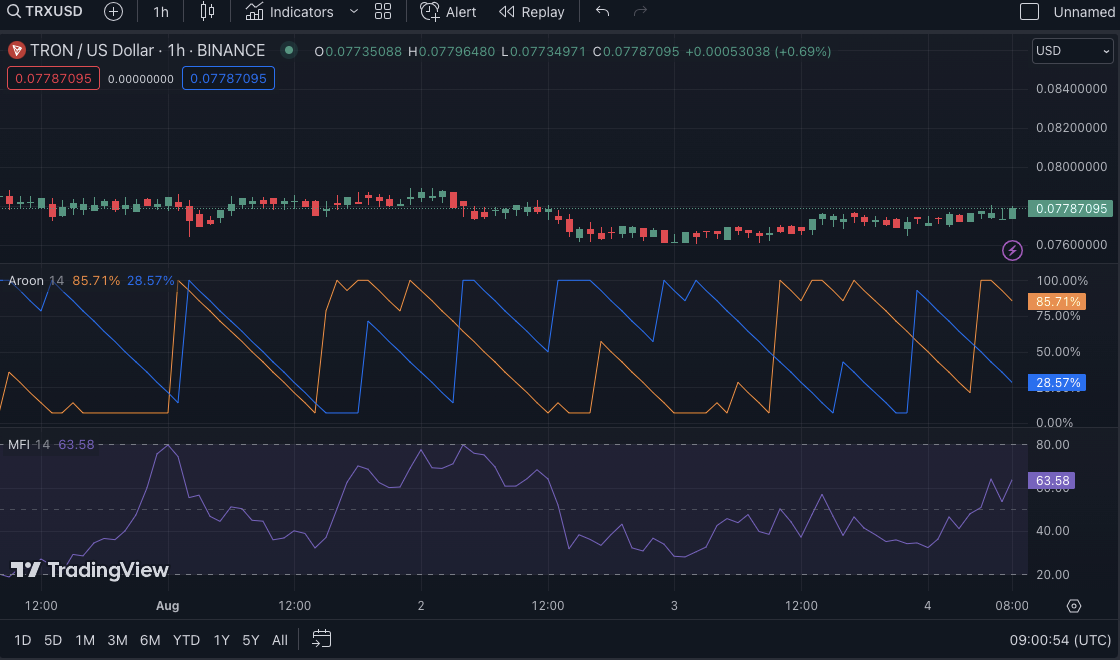
Strong bullish momentum can be seen in the TRXUSD, with the Aroon up at 85.71% and the Aroon down at 28.57%. The low Aroon down reading suggests less downward momentum, while the high Aroon up reading suggests TRXUSD has consistently reached new highs.
This combination indicates a bullish market sentiment and the possibility of additional price gains. A continuation of TRXUSD’s uptrend would be indicated by a higher Aroon up reading and a lower Aroon down reading.
However, if the Aroon up reading rises to extremely high levels (above 90), traders should be wary of an overbought condition and potential selling pressure.
The Money Flow index is currently at 63.56, above the 50 level, indicating positive money flow into TRXUSD, adding to the bullish momentum. This level indicates that buyers are active and that further price increases are possible. However, close attention to the MFI level is warranted, as a value over 80 suggests an overbought condition and possible reversal in price.
In conclusion, TRX’s bullish surge remains strong, but caution is advised as indicators point towards possible overbought conditions.
Disclaimer: The views, opinions, and information shared in this price prediction are published in good faith. Readers must do their research and due diligence. Any action taken by the reader is strictly at their own risk. Coin Edition and its affiliates will not be liable for direct or indirect damage or loss.
Disclaimer: The information presented in this article is for informational and educational purposes only. The article does not constitute financial advice or advice of any kind. Coin Edition is not responsible for any losses incurred as a result of the utilization of content, products, or services mentioned. Readers are advised to exercise caution before taking any action related to the company.


