


- TRON (TRX) sees a bullish shift, this could indicate a potential recovery for the token.
- The current rising interest has boosted Tron’s market capitalization.
- Moreover, several technical indicators have signaled TRON’s positive momentum.
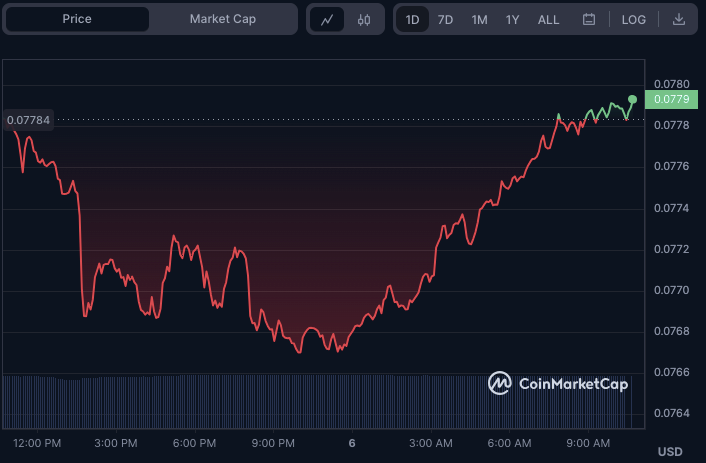
TRON (TRX) experienced a prolonged bearish period in the market over the past 24 hours. However, as negative momentum began to fade, a notable shift occurred. Bulls stepped in, triggering a significant price jump from $0.07669 to $0.07783, suggesting a potential recovery.
The $0.07669 support level played a crucial role during the bearish phase. Should the bearish momentum return and breach this level, traders should keep a close eye on the $0.07500 mark. A break below this level could open the door for a deeper correction toward $0.07300 or even $0.07000.
Conversely, if the current bullish sentiment prevails, TRON might ascend to test the $0.08000 barrier. Surpassing this level would indicate a bullish continuation and pave the way for a short-term advance toward $0.08500 or even $0.09000. The market remains poised for further movement as bulls vie for control.
Regarding market capitalization, TRX experienced a modest 0.02% climb to reach $6,998,121,259 within the same period. This increase indicates rising interest and engagement in the TRON ecosystem. Additionally, the 24-hour trading volume rose by 1.00% to $153,385,645, further signaling an uptick in activity within the TRON market.
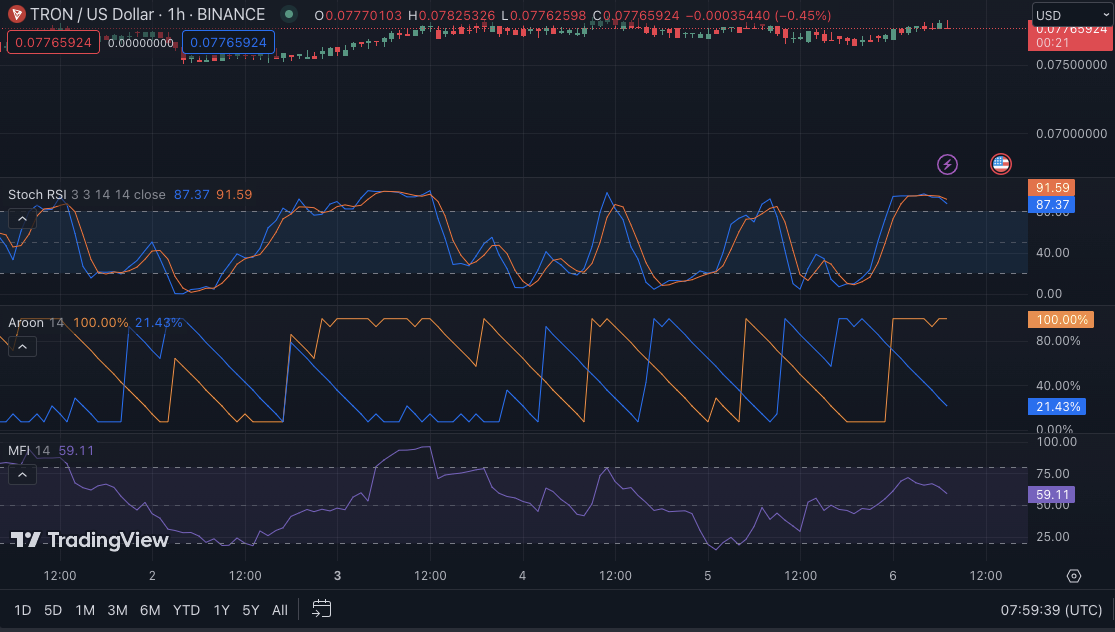
TRX/USD Technical Analysis
The stochastic RSI, a popular indicator used to identify overbought or oversold conditions, currently reads 96.78. This high value indicates that TRX has recently experienced significant buying pressure, potentially driving higher prices.
Moreover, the Aroon up and down readings are 92.86% and 21.43%, respectively. This move suggests a stronger uptrend, with the Aroon up indicator surpassing its down counterpart. TRON’s positive momentum is reinforced by these figures, indicating the potential for further upward movement in the market.
Additionally, the Money Flow Index (MFI), a commonly used oscillator, currently reads 59.62. With this score falling within a neutral range, it suggests that TRX has seen steady inflows and outflows of capital. This balanced MFI reading reflects the overall stability of TRON amid its recent price movements.
In conclusion, TRON (TRX) shows signs of recovery as bulls regain control, triggering a price jump and indicating a potential upside. Market sentiment, technical indicators, and rising interest point towards a promising outlook for TRON’s future.
Disclaimer: The views, opinions, and information shared in this price prediction are published in good faith. Readers must do their research and due diligence. Any action taken by the reader is strictly at their own risk. Coin Edition and its affiliates will not be liable for direct or indirect damage or loss.
Disclaimer: The information presented in this article is for informational and educational purposes only. The article does not constitute financial advice or advice of any kind. Coin Edition is not responsible for any losses incurred as a result of the utilization of content, products, or services mentioned. Readers are advised to exercise caution before taking any action related to the company.


