
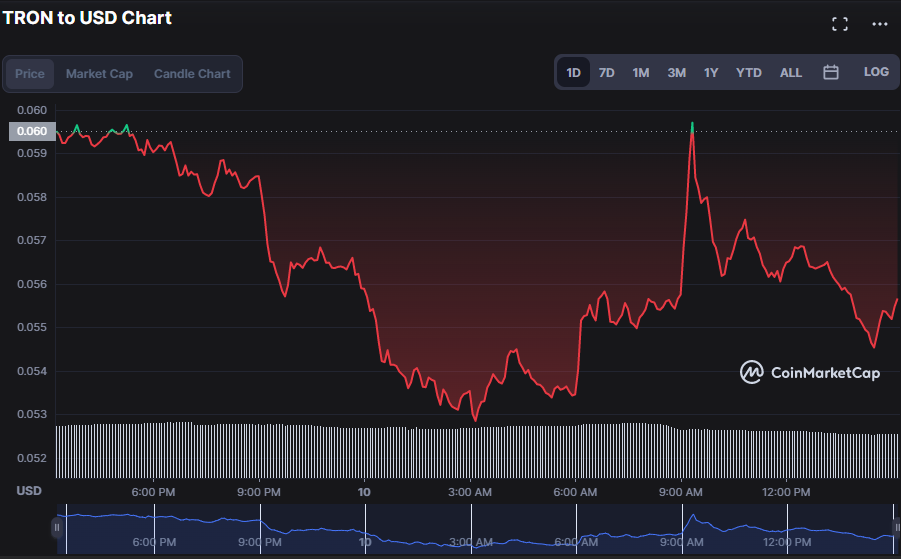
- TRX (TRX) has shed 5.12% of its value and is now priced at $0.05633.
- Technical indicators forecast TRX market will continue to plummet.
- TRX finds support at $0.05277 and resistance at $0.05974.
TRON price activity has been bearish over the previous 24 hours, with the digital currency dropping by 5.12% to $0.05633 as of press time.
Aspects that may have influenced this price activity include a 7.07% drop in market capitalization to $5,143,432,644 and a 14.82% drop in 1-day trading volume to $1,633,798,102 in the last 24 hours.
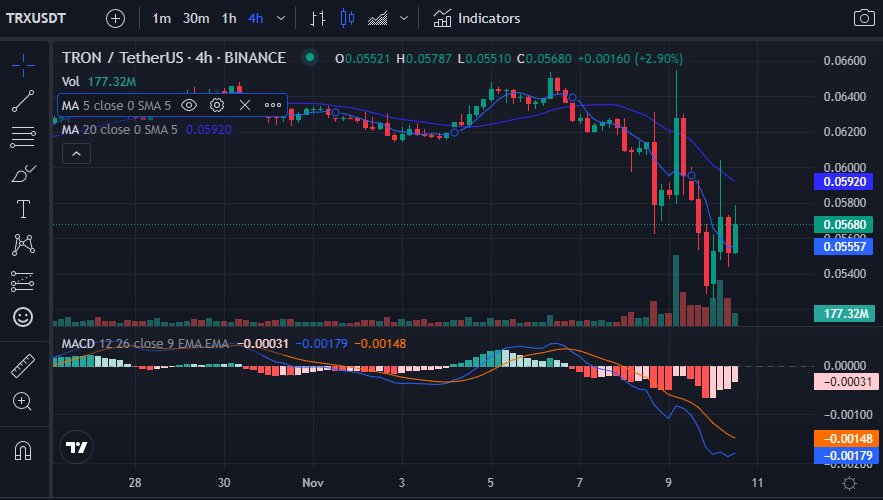
A pessimistic fusion pattern is obvious as the long-term MA crosses over the short-term MA, as seen in the TRON 1-hour price chart, with the 5-day MA touching 0.05554 and the 20-day MA touching 0.05920. The market moving below both MAs is a bearish indicator supporting this negative market trend.
The Moving Average Convergence Divergence (MACD) is in deep recession, with a reading of -0.00179, and a negative crossover is seen as the blue MACD line crosses below the signal line.
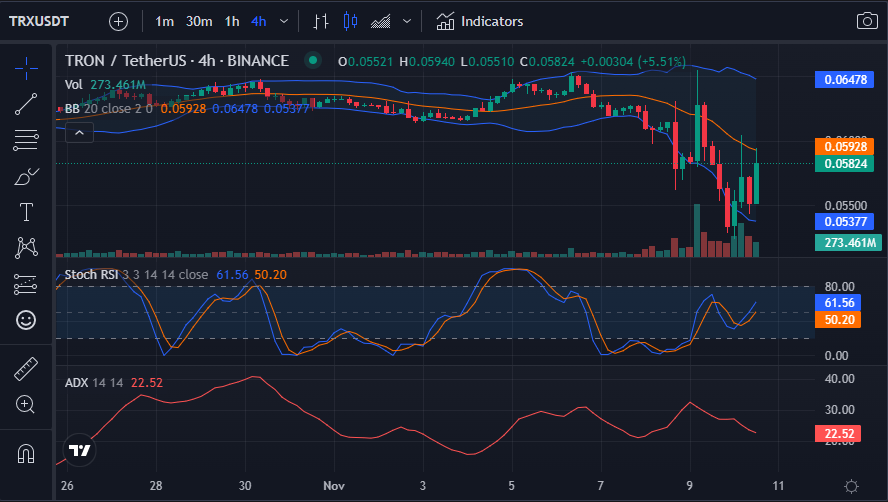
The Bollinger Bands are widening in the TRX market, reflecting selling pressure, and the bands’ pointing downwards is reinforcing this distinct pattern. The upper band is at 0.06481, while the bottom band is at 0.05358. This adverse momentum is also backed by the market’s drift toward the lower band.
The Stochastic RSI is 62.74, indicating an uncertain market direction due to equal buying and selling pressure at this level; nevertheless, if the bulls fail to reverse this troubling trend, the Stoch RSI score will shift towards the oversold region.
As bears dominate the TRX market, the Average Direction Index (ADX) points south, with a reading of 22.52, indicating that the near term is likewise bearish.
Bulls must maintain the resistance level and drive prices higher to invalidate the prevailing downtrend observable on the TRON market.
Disclaimer: The views and opinions, as well as all the information shared in this price prediction, are published in good faith. Readers must do their research and due diligence. Any action taken by the reader is strictly at their own risk. Coin Edition and its affiliates will not be held liable for any direct or indirect damage or loss.
Disclaimer: The information presented in this article is for informational and educational purposes only. The article does not constitute financial advice or advice of any kind. Coin Edition is not responsible for any losses incurred as a result of the utilization of content, products, or services mentioned. Readers are advised to exercise caution before taking any action related to the company.


 Price Prediction: UNI Eyes $5 as UNI Extends Bullish Breakout")

