


- Glassnode shared that two on-chain metrics for BTC have reached new highs recently.
- BTC’s Amount of Supply Last Active 2y-3y (1d MA) has reached a 2-year high of 2,675,323.424 BTC.
- BTC is currently trading hands at $27,462.55 after a 1.03% price drop.
The on-chain analysis platform glassnode alerts (@glassnodealerts) took to Twitter this morning to share some recent on-chain metrics for the crypto market leader Bitcoin (BTC). According to these tweets, two of BTC’s metrics reached new highs recently.
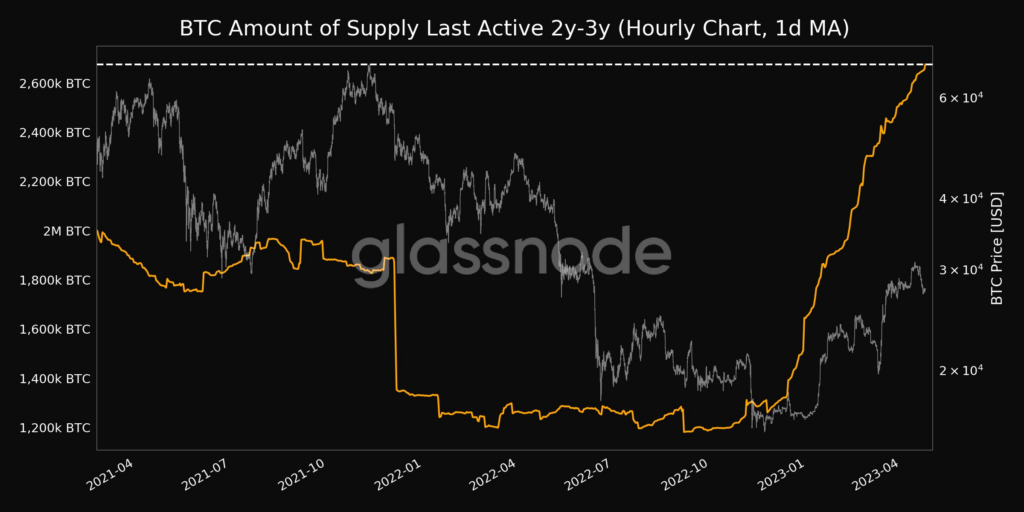
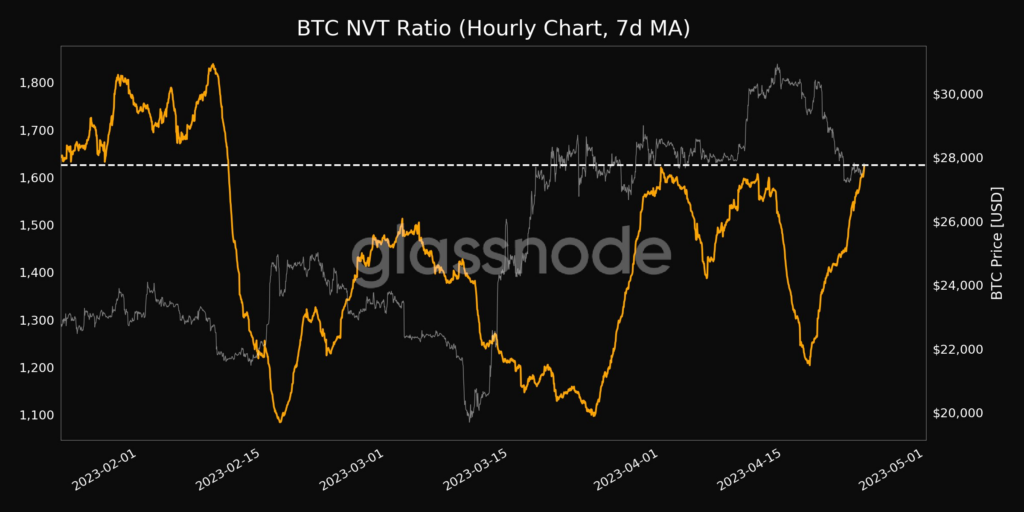
The first post by glassnode revealed that BTC’s Amount of Supply Last Active 2y-3y (1d MA) has reached a 2-year high of 2,675,323.424 BTC. Meanwhile, the second post by the analysis platform revealed that BTC’s NVT Ratio (7d MA) has just reached a 1-month high of 1,625.697. The previous 1-month high for BTC’s NVT Ratio was 1,620.904, and was observed on the first day of April 2023.
In addition, the crypto market tracking website CoinMarketCap indicates that BTC is currently trading hands at $27,462.55 after a 1.03% price drop over the last 24 hours. Despite this, BTC was able to strengthen against its competitor Ethereum (ETH) by approximately 0.49%.
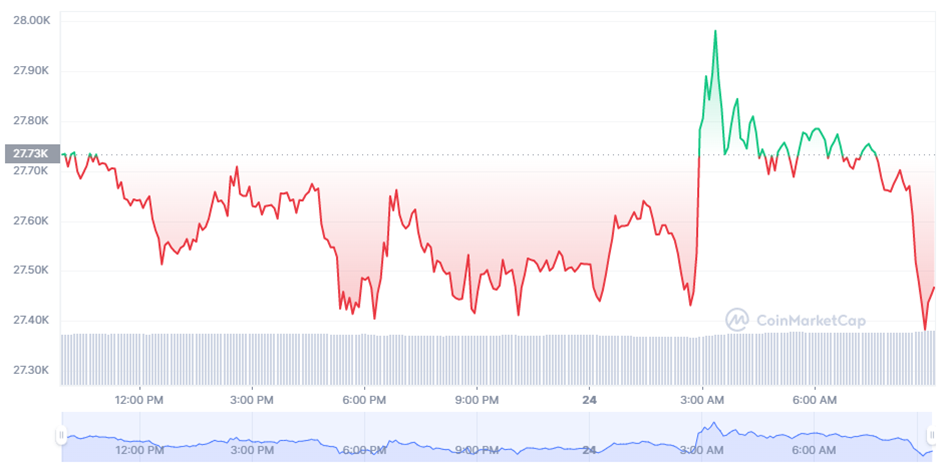
This 24-hour performance from the crypto king pushed its weekly performance even further into the red. At press time, BTC is down more than 8% over the last seven days. BTC’s 24-hour trading volume also currently stands at $14,258,856,974 after a more than 7% increase since yesterday.
The recent price movement for BTC has brought down its market cap to $531,670,140,785 at press time. Nevertheless, BTC was still able to outperform the altcoin market over the last 24 hours, as its market dominance has increased around 0.09% during this period.
Disclaimer: The views and opinions, as well as all the information shared in this price analysis, are published in good faith. Readers must do their own research and due diligence. Any action taken by the reader is strictly at their own risk. Coin Edition and its affiliates will not be held liable for any direct or indirect damage or loss.
Disclaimer: The information presented in this article is for informational and educational purposes only. The article does not constitute financial advice or advice of any kind. Coin Edition is not responsible for any losses incurred as a result of the utilization of content, products, or services mentioned. Readers are advised to exercise caution before taking any action related to the company.
 Price Prediction: Can BTW Sustain Its Breakout Above $0.1032?")


