


- A bullish continuation pattern has formed for the TWT.
- This indicates that there is likely to be a strong upward movement in price over the coming days.
- Strong support has been established at the $2.0 level, providing a crucial barrier that traders will be watching closely moving forward.
The Trust Wallet Token (TWT) price analysis reveals the token is trading in an upward market sentiment amid the broad-based market retracement. Trust Wallet token opened the daily trading session at a low of $2.56 and has been climbing steadily in the daily trading session. The token price has been gaining momentum from the support level at $2.5 and is trading at $2.64, a price surge of 2.45%.
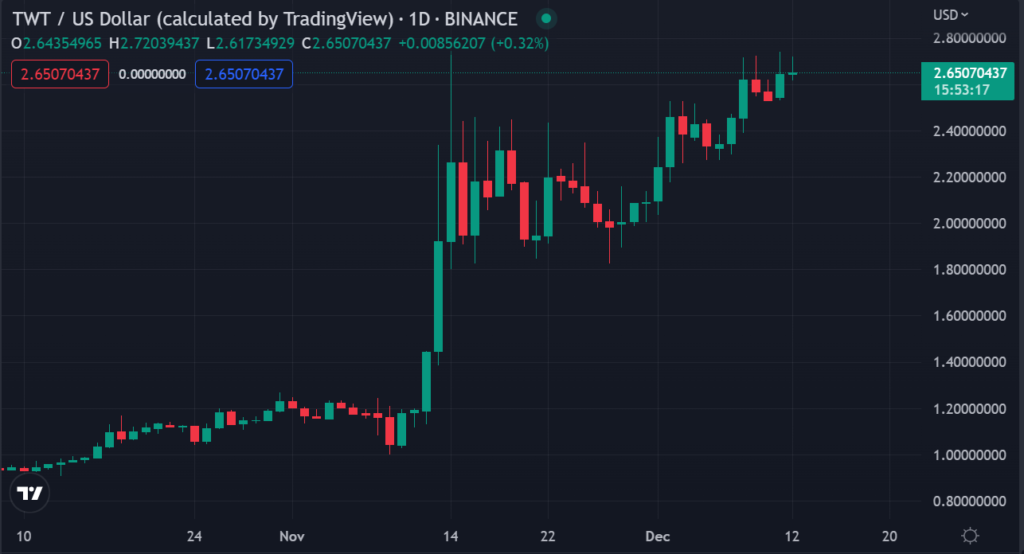
The token has been trading in a bullish trend for the last 5 days and a bullish continuation pattern has formed, suggesting that the bullish trend is likely to continue. In addition, the support level at $2.5 provides a crucial barrier for any potential pullbacks, while traders will be keeping an eye on the key resistance level at $3.0. The trading volume has surged by 129% and is currently sitting at $86,751,142.
TWT price analysis on a daily price chart shows the bulls have been active on the hourly price chart with bullish candlesticks. The currency strength index has climbed higher and is now more than 70 points in the overbought zone, suggesting that further gains are likely ahead for the token.
The 50-day MA has crossed above the 200-day MA, indicating a bullish market sentiment for the TWT. Bulls seem to be looking to break above the key resistance level at $3.0, and the next key resistance level is expected around $4.0.
TWT’s technical outlook remains bullish as long as the price stays above $2.0 and traders will be watching for any signs of a potential pullback or correction before entering any new positions. The Stochastic RSI is in the overbought zone and approaching the 80 levels, suggesting that a price retracement may be imminent.
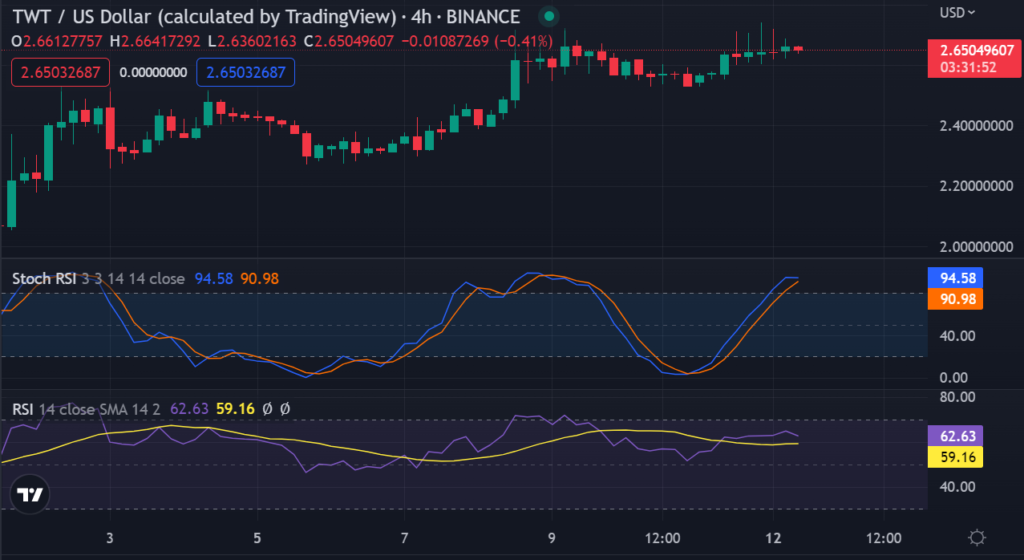
A Fibonacci retracement analysis shows that the token price is currently testing a major resistance level at $2.80, which could be breached in the coming days if the momentum continues to build. Traders can look to enter long positions on any pullback from this level with a stop loss below $2.7 and aim to take profit levels around $3.0 and $4.0.
Overall, the Trust Wallet Token continues to be a bullish trend despite the negative market sentiment. However, a profit-taking sell-off could lead to a bearish price correction soon.
Disclaimer: The views and opinions, as well as all the information shared in this price analysis, are published in good faith. Readers must do their own research and due diligence. Any action taken by the reader is strictly at their own risk. Coin Edition and its affiliates will not be held liable for any direct or indirect damage or loss.
Disclaimer: The information presented in this article is for informational and educational purposes only. The article does not constitute financial advice or advice of any kind. Coin Edition is not responsible for any losses incurred as a result of the utilization of content, products, or services mentioned. Readers are advised to exercise caution before taking any action related to the company.

: What Happens If You Use an Unlicensed Platform?")


